. 2009:5:311.
doi: 10.1038/msb.2009.71. Epub 2009 Oct 13.

Viral adaptation to host: a proteome-based analysis of codon usage and amino acid preferences

Affiliations

Viral adaptation to host: a proteome-based analysis of codon usage and amino acid preferences

Iris Bahir et al. Mol Syst Biol. 2009.

Abstract

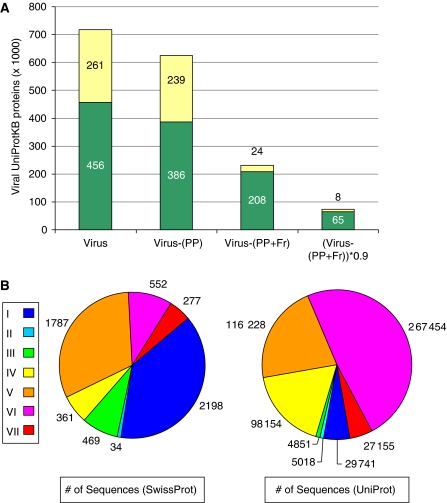
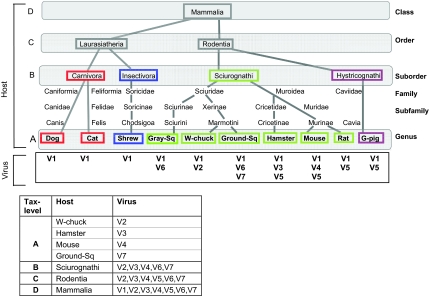
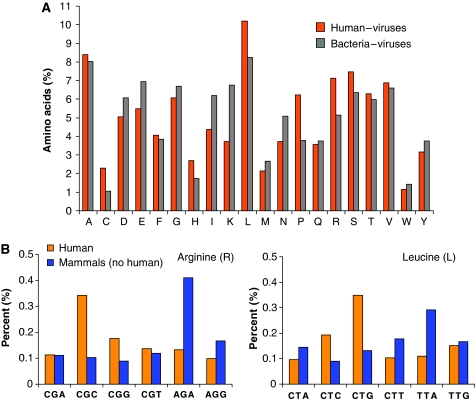
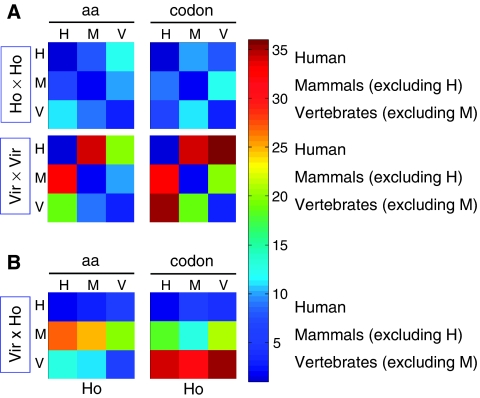
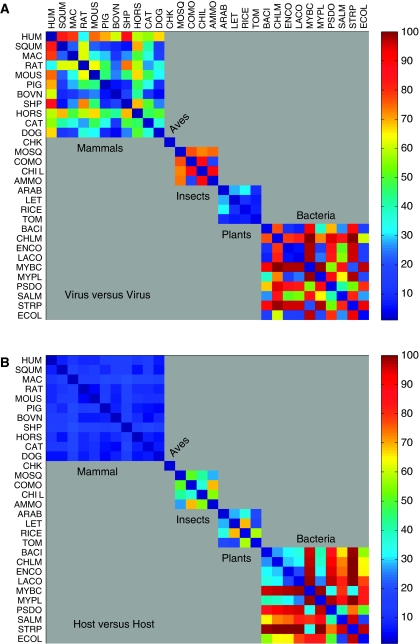
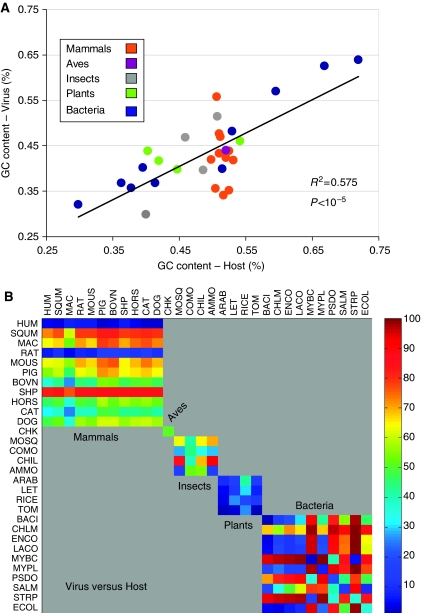
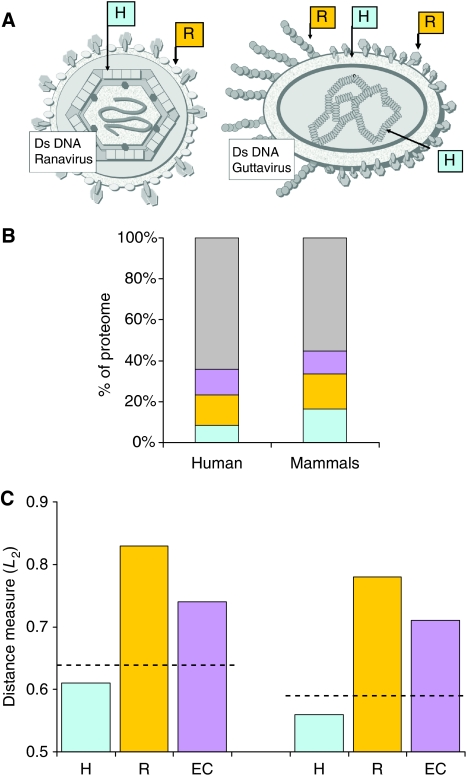
Viruses differ markedly in their specificity toward host organisms. Here, we test the level of general sequence adaptation that viruses display toward their hosts. We compiled a representative data set of viruses that infect hosts ranging from bacteria to humans. We consider their respective amino acid and codon usages and compare them among the viruses and their hosts. We show that bacteria-infecting viruses are strongly adapted to their specific hosts, but that they differ from other unrelated bacterial hosts. Viruses that infect humans, but not those that infect other mammals or aves, show a strong resemblance to most mammalian and avian hosts, in terms of both amino acid and codon preferences. In groups of viruses that infect humans or other mammals, the highest observed level of adaptation of viral proteins to host codon usages is for those proteins that appear abundantly in the virion. In contrast, proteins that are known to participate in host-specific recognition do not necessarily adapt to their respective hosts. The implication for the potential of viral infectivity is discussed.


Conflict of interest statement

The authors declare that they have no conflict of interest.

Figures

Figure 1
Figure 1
Viral proteins from UniProtKB. (A) Total number of UniProtKB viral proteins [Virus], following filtration by removal of proteins with the database term ‘polyprotein' [Virus-(PP)], proteins that are marked as fragments [Virus-(PP+Fr)], and after removal of redundancy at the level of 90% sequence identity [(Virus-(PP+Fr))*0.9]. The fraction of viral proteins of the human immunodeficiency virus (HIV) is in yellow, and the number of proteins is as indicated (in thousands). (B) Partition of all proteins of 121 human-infecting viruses (from 50 virus genera) by viral classification into the 7 Baltimore classes and by the number of proteins in each class. Note the significant change in the fraction of proteins in each class when the manually reviewed data resource (SwissProt) or all data (UniProtKB) are considered. Source data and additional clinical information can be found in Supplementary Table S1.
Figure 2
Figure 2
Mapping of viruses to hosts. (Top) a tree is drawn according to the hierarchical taxonomy of the hosts (from class to genus, based on NCBI taxonomy). The hosts that are unified at the suborder level are framed with an identical color. The four levels (A–D) represent the host grouping at the genus, suborder, order, and class levels, respectively. Below each host, the viruses that infect it are listed. (Bottom) for each taxonomy level, the virus-to-host mapping resulting from the tree is shown. Ambiguity in mapping of viruses to their hosts results from viruses that are annotated to infect a group of hosts that are not uniquely defined at the taxonomical level of interest (e.g., V5 not uniquely defined at level B). In this real-life example, V1–V7 are Mokola virus, Woodchuck hepatitis B virus, Hamster polyomavirus, Murine coronavirus, Sendai virus, Artic squirrel hepatitis virus, and Ground squirrel hepatitis virus, respectively.
Figure 3
Figure 3
Amino acid distribution and codon usage in viruses infecting taxonomy-unified hosts. (A) Amino acid distribution for human-infecting viruses (orange) and bacteria-infecting viruses (gray). The analysis is based on the complete proteomes of the mapped viruses. (B) The relative codon usage of the six triplets that code for Arginine (R) and Leucine (L) in human-infecting viruses (yellow) and viruses that infect non-human mammals (blue). Such data, when combined for all codons (excluding triplets for Tryptophan and Methionine), produce a vector of 59 codon frequencies that is subsequently used for quantifying the distance between any pair of virus and host groups.
Figure 4
Figure 4
Distance matrices for the similarity of amino acid distribution and codon usage between viruses and hosts mapped at high-level taxonomies. The analysis is based on the complete proteomes of the mapped viruses following partition into six taxonomical groups. For the complete matrices that include plants, insects, and bacteria, see Supplementary information S1. (A) Viruses that infect humans (H), mammalians excluding human (M), and vertebrates excluding humans (V). aa and codon indicate the L2 distance of amino acids and codon usage, respectively. The pairwise distances among the hosts and among the viruses are marked as Ho × Ho and Vir × Vir, respectively. Color code (1–36) is according to the ranking of the 36 values of all pairs used in the respective analysis, from blue (minimal distance, most similar) to red (maximal distance). (B) The Vir × Ho analysis shows the L2 distances between viruses and hosts. Note that this matrix is not symmetric and that the x- and y-axes show the hosts (Ho) and the viruses (Vir), respectively. Source data is available for this figure at www.nature.com/msb.
Figure 5
Figure 5
Distance matrix for the similarity in codon usage between pairs of viruses and pairs of hosts. Color code is based on the ranking of all 900 L2 values, as calculated from all pairs of 30 viruses and 30 unique hosts. The matrix is organized by groups according to Table I. (A) Symmetric L2 distance matrix for all 30 viruses (B) Symmetric L2 distance matrix for all 30 hosts. The analysis is based on the complete proteomes of the mapped viruses. The sub-matrices indicate the partition into groups of mammals (1–11), aves (12), insects (13–16), plants (17–20), and bacteria (21–30). Note the large diversity among viruses infecting mammals, insects, and bacteria (A) and the strong resemblance among the mammalian hosts (B). Source data is available for this figure at www.nature.com/msb.
Figure 6
Figure 6
Similarity in GC content and codon usage between pairs of viruses and hosts. The GC content from the proteomes of all viruses and their hosts was compiled. (A) Analysis of the GC content correlation between the hosts (x-axis) and viruses (F-test for linear regression), color coded by their taxonomical grouping to mammals, aves, insects, plants, and bacteria (according to Table I). (B) Codon usage distance matrix for all pairs of hosts and viruses is shown. Color code is according to the ranking of all 900 values as calculated from all pairs of 30 viruses and 30 unique hosts. The matrix is organized by groups according to Table I. L2 distance matrix for all 30 viruses (y-axis) and 30 unique hosts (x-axis). The analysis is based on the complete proteomes of the mapped viruses. The sub-matrices indicate the partition to groups of mammals (1–11), aves (12), insects (13–16), plants (17–20), and bacteria (21–30). Note the strong resemblance in human and rat viruses relative to all other mammals and the resemblance among all viruses infecting plants. For data of the complete matrix, see Supplementary information S2.
Figure 7
Figure 7
Codon usage adaptation for functional groups of viral proteins. Viral proteins annotated as ‘complete proteome' were classified according to the taxonomic view of their hosts—for humans and mammals (excluding human). The analysis for human-infecting viruses includes 2186 proteins and for mammals (excluding humans) 513 proteins. (A) Graphical schemes of enveloped viruses (adapted from the ViralZone illustrations) are shown. Proteins that are exposed on the virus surface and are part of the host receptor recognition include proteins annotated as glycoprotein, coat, spike, and fiber (marked ‘R', orange). Capsids, core, and structural proteins are characterized by high expression (marked ‘H', light blue). Capsids may appear in multiple layers (intermediate and inner capsids). Other proteins expressed in large quantities include core, matrix, tegument, DNA-packing proteins, and nucleoproteins. (B) Partition of the proteomes to functional groups of surface-protein recognition (orange), structural protein with high copy number in the virion (light blue), enzymes as defined by the E.C. enzyme annotation (purple), and uncharacterized viral proteins (gray). (C) The overall similarity, as measured by L2 distance (see Materials and methods), is shown according to each of the functional partitions of proteins. Lower value indicates higher resemblance. The distance measure for the entire set of viral proteomes is marked by the dashed line. Source data is available for this figure at www.nature.com/msb.

References

    1. Akashi H (2001) Gene expression and molecular evolution. Curr Opin Genet Dev 11: 660–666 - PubMed
    1. Apweiler R, Bairoch A, Wu CH, Barker WC, Boeckmann B, Ferro S, Gasteiger E, Huang H, Lopez R, Magrane M, Martin MJ, Natale DA, O'Donovan C, Redaschi N, Yeh LS (2004) UniProt: the Universal Protein knowledgebase. Nucleic Acids Res 32: D115–D119 - PMC - PubMed
    1. Barrai I, Salvatorelli G, Mamolini E, De Lorenzi S, Carrieri A, Rodriguez-Larralde A, Scapoli C (2008) General preadaptation of viral infectors to their hosts. Intervirology 51: 101–111 - PubMed
    1. Barrai I, Scapoli C, Barale R, Volinia S (1990) Oligonucleotide correlations between infector and host genomes hint at evolutionary relationships. Nucleic Acids Res 18: 3021–3025 - PMC - PubMed
    1. Barrett JW, Sun Y, Nazarian SH, Belsito TA, Brunetti CR, McFadden G (2006) Optimization of codon usage of poxvirus genes allows for improved transient expression in mammalian cells. Virus Genes 33: 15–26 - PMC - PubMed

Publication types