. 2009:5:321.
doi: 10.1038/msb.2009.80. Epub 2009 Nov 3.

Edgetic perturbation models of human inherited disorders

Affiliations

Edgetic perturbation models of human inherited disorders

Quan Zhong et al. Mol Syst Biol. 2009.

Abstract

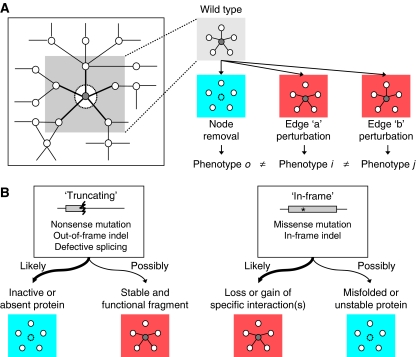
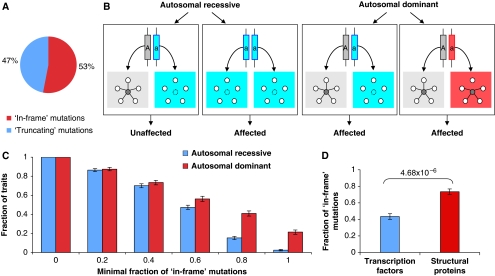
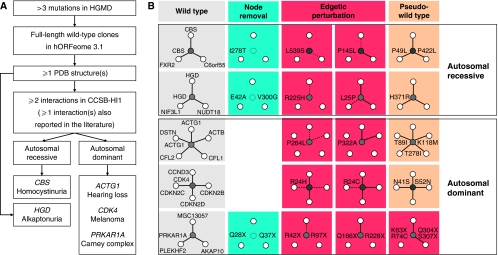
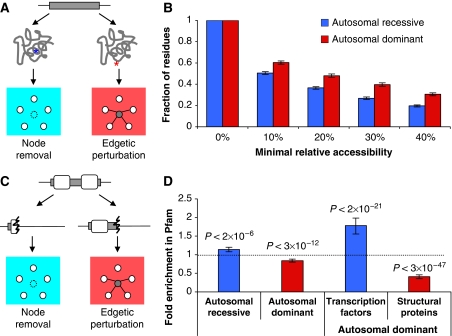
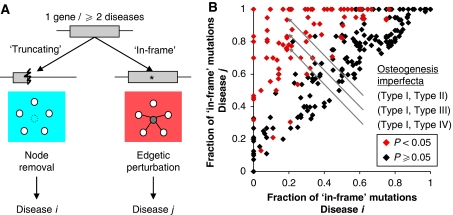
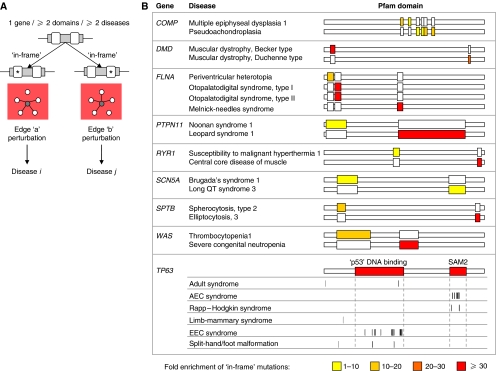
Cellular functions are mediated through complex systems of macromolecules and metabolites linked through biochemical and physical interactions, represented in interactome models as 'nodes' and 'edges', respectively. Better understanding of genotype-to-phenotype relationships in human disease will require modeling of how disease-causing mutations affect systems or interactome properties. Here we investigate how perturbations of interactome networks may differ between complete loss of gene products ('node removal') and interaction-specific or edge-specific ('edgetic') alterations. Global computational analyses of approximately 50,000 known causative mutations in human Mendelian disorders revealed clear separations of mutations probably corresponding to those of node removal versus edgetic perturbations. Experimental characterization of mutant alleles in various disorders identified diverse edgetic interaction profiles of mutant proteins, which correlated with distinct structural properties of disease proteins and disease mechanisms. Edgetic perturbations seem to confer distinct functional consequences from node removal because a large fraction of cases in which a single gene is linked to multiple disorders can be modeled by distinguishing edgetic network perturbations. Edgetic network perturbation models might improve both the understanding of dissemination of disease alleles in human populations and the development of molecular therapeutic strategies.


Conflict of interest statement

The authors declare that they have no conflict of interest.

Figures

Figure 1
Figure 1
Node removal versus edgetic perturbation models of network changes underlying phenotypic alterations. (A) Schematic illustration of pleiotropic phenotypic outcomes resulting from distinct network perturbations upon complete loss of gene product (node removal, blue box) versus perturbation of specific molecular interactions (edgetic perturbation, red box). Solid lines between two nodes represent preserved interactions and dashed lines represent perturbed interactions. Edges are generally biophysical interactions, but could also be biochemical interactions. (B) Schematic illustration of distinct ‘truncating' versus ‘in-frame' mutations causing distinct molecular defects in proteins leading to distinct node removal versus edgetic perturbation.
Figure 2
Figure 2
Global patterns of disease mutations in human genetic disorders. (A) Subdivision of ‘truncating' versus ‘in-frame' mutations in Human Gene Mutation Database (HGMD) (Stenson et al, 2003). (B) Schematic illustration of distinct node removal versus edgetic perturbation models in disease with autosomal recessive versus autosomal dominant inheritance. (C) Distribution of autosomal recessive and dominant disease with respect to the associated ‘in-frame' mutations. Mutations in each gene associated with each mode of inheritance are grouped as one trait. Each data point represents the fraction of autosomal recessive (blue bar) or autosomal dominant (red bar) traits that have a fraction of ‘in-frame' mutations no less than the value on the x-axis. Statistical significance of the observed difference between distributions is assessed by Mann–Whitney U test (P<9.2 × 10⁻¹²). The number of traits, genes, diseases and total mutations in each bin are provided in Supplementary Table 1. (D) Average fraction of ‘in-frame' mutations associated with autosomal dominant disease in transcription factors and structural proteins. P-value assessed by Mann–Whitney U test of the observed difference is shown.
Figure 3
Figure 3
Profiling allele-specific interaction defects of disease-causing mutant proteins. (A) Schematic illustration of selection of disease proteins for proof-of-principle analysis of binary protein interaction defects of disease-causing mutant proteins. (B) Interpreted network perturbations for each allele comparing to corresponding wild-type proteins. Missing lines represent lost protein interactions. Dashed lines represent reduced protein interactions. Color codes for distinct network perturbations are indicated at the top panel.
Figure 4
Figure 4
Structural analyses of disease-causing mutations in HGMD. (A) Schematic illustration of distinct positions of missense mutations in the three-dimensional structure of a given protein probably causing node removal versus edgetic perturbation. (B) Distribution of accessible residues among mutations associated with autosomal recessive diseases (blue bar) and with autosomal dominant ones (red bar). (C) Schematic illustration of distinct positions of ‘truncating' mutations with respect to protein domains probably causing node removal versus edgetic perturbation. (D) Distribution of ‘truncating' mutations in Pfam domains. Fold enrichment higher than one means that Pfam domains contain more mutations than expected at random, whereas enrichment between zero and one means that Pfam domains are depleted in mutations. P-values assess the significance of the observed fold enrichment.
Figure 5
Figure 5
Distinct node removal versus edgetic perturbation underlying pleiotropy. (A) Schematic illustration of distinct ‘truncating' versus ‘in-frame' mutations in a single gene product causing distinct network perturbations giving rise to distinct disorders. (B) Analysis of ‘in-frame' mutations found in genes associated with multiple diseases. Each dot represents the fraction of ‘in-frame' mutations of a pair of distinct diseases associated with a common gene. x-axis represents the smaller fraction of ‘in-frame' mutation in each pair and y-axis represents the larger fraction. Significantly different fractions of ‘in-frame' mutation between each pair of diseases are represented by red dots (P<0.05). Statistically indistinguishable pairs are represented in black. Three gray arrows pointing to three disease pairs corresponding to Type I and Type II, III or IV Osteogenesis Imperfecta, with ‘in-frame' mutation fraction of 0.19 and 0.93, 0.83, 0.75 respectively.
Figure 6
Figure 6
Distinct edgetic perturbations underlying pleiotropy. (A) Schematic illustration of distinct ‘in-frame' alleles in a single gene product causing distinct network perturbations giving rise to distinct disorders. (B) Enrichment of ‘in-frame' mutations causing different disorders in different Pfam domains. Color intensity of Pfam domains represents fold enrichment of each disease associated ‘in-frame' mutations (P<0.05). Vertical lines below corresponding Pfam domains mark disease-causing ‘in-frame' mutations in TP63.

References

    1. Ball CA, Dolinski K, Dwight SS, Harris MA, Issel-Tarver L, Kasarskis A, Scafe CR, Sherlock G, Binkley G, Jin H, Kaloper M, Orr SD, Schroeder M, Weng S, Zhu Y, Botstein D, Cherry JM (2000) Integrating functional genomic information into the Saccharomyces genome database. Nucleic Acids Res 28: 77–80 - PMC - PubMed
    1. Botstein D, Risch N (2003) Discovering genotypes underlying human phenotypes: past successes for mendelian disease, future approaches for complex disease. Nat Genet 33 : 228–237 - PubMed
    1. Braun P, Tasan M, Dreze M, Barrios-Rodiles M, Lemmens I, Yu H, Sahalie JM, Murray RR, Roncari L, de Smet AS, Venkatesan K, Rual JF, Vandenhaute J, Cusick ME, Pawson T, Hill DE, Tavernier J, Wrana JL, Roth FP, Vidal M (2009) An experimentally derived confidence score for binary protein–protein interactions. Nat Methods 6: 91–97 - PMC - PubMed
    1. Chenna R, Sugawara H, Koike T, Lopez R, Gibson TJ, Higgins DG, Thompson JD (2003) Multiple sequence alignment with the Clustal series of programs. Nucleic Acids Res 31: 3497–3500 - PMC - PubMed
    1. Chik JK, Lindberg U, Schutt CE (1996) The structure of an open state of β-actin at 2.65 Å resolution. J Mol Biol 263: 607–623 - PubMed

Publication types