. 2010 Feb;30(2):403-14.
doi: 10.1038/jcbfm.2009.231. Epub 2009 Nov 4.

The energy use associated with neural computation in the cerebellum

Affiliations

The energy use associated with neural computation in the cerebellum

Clare Howarth et al. J Cereb Blood Flow Metab. 2010 Feb.

Abstract

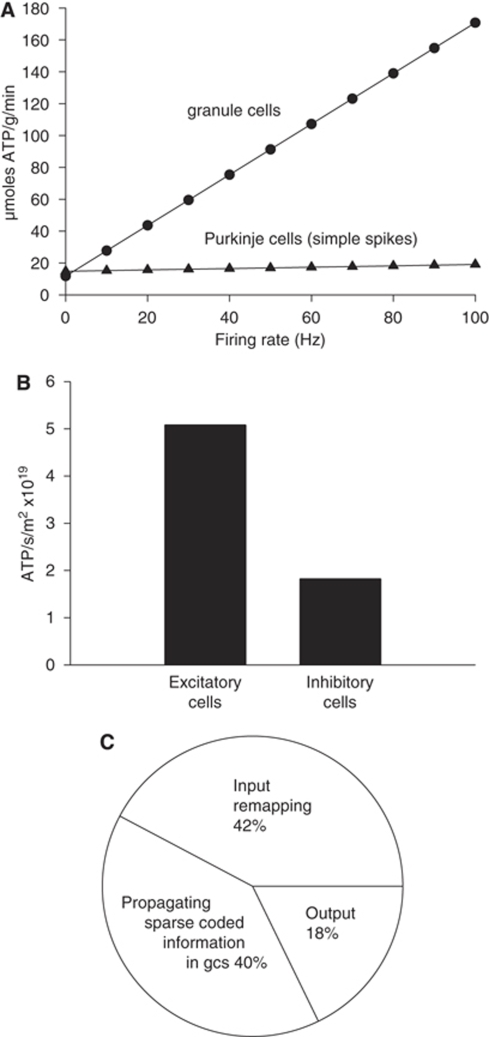
The brain's energy supply determines its information processing power, and generates functional imaging signals, which are often assumed to reflect principal neuron spiking. Using measured cellular properties, we analysed how energy expenditure relates to neural computation in the cerebellar cortex. Most energy is used on information processing by non-principal neurons: Purkinje cells use only 18% of the signalling energy. Excitatory neurons use 73% and inhibitory neurons 27% of the energy. Despite markedly different computational architectures, the granular and molecular layers consume approximately the same energy. The blood vessel area supplying glucose and O(2) is spatially matched to energy consumption. The energy cost of storing motor information in the cerebellum was also estimated.


Figures

Figure 1
Figure 1
Predicted energy use for cerebellar cortex with all cell types firing at their physiological rate. (A) Schematic diagram showing the cell types considered. Note that parallel fibres in reality make en passant (non-terminal) synapses. (B) Cellular distribution of predicted energy use (ATP used per cell). Key: P, Purkinje cell; Go, Golgi cell; s, stellate cell; b, basket cell; g, granule cell; mf mossy fibre; cf, climbing fibre; a, astrocyte; Bg, Bergmann glia. (C) Cellular distribution of energy use, taking density of cells into account (ATP use per class of cell). (D) Energy distribution among subcellular processes (summed over all cell types, weighted by cell densities). Resting potentials account for approximately 42% of the energy use, action potentials 36%, postsynaptic receptors 17%, neurotransmitter recycling (ATP used in glia and on packaging transmitter into vesicles in the releasing cell) 2%, and presynaptic Ca2+ entry and vesicle cycling 3%. (E) As D, but including non-signalling energy use, assumed to be 4 μmol ATP per g per min (see text). Housekeeping tasks account for 19% of the energy use, resting potentials 34%, action potentials 29%, postsynaptic receptors 14%, neurotransmitter recycling (ATP used in glia and on packaging transmitter into vesicles in the releasing cell) 2%, and presynaptic Ca2+ entry and vesicle cycling 2%.
Figure 2
Figure 2
The subcellular distribution of energy use varies according to cell type. (A) Granule cells. Most energy is used to propagate action potentials and maintain the resting potential along the long parallel fibres. (B) Purkinje cells. Most energy is used on action potentials and postsynaptic receptors. (C, D) Inhibitory neurons use most energy on postsynaptic currents and action potentials. (C) Molecular layer interneurons. (D) Golgi cells. Key: rp, resting potential; ap, action potentials; post-syn, postsynaptic receptors; re-cyc, transmitter recycling (ATP used on glial uptake of transmitter and its metabolic processing, and on packaging transmitter into vesicles in the releasing cell); pre-syn, presynaptic Ca2+ entry and vesicle cycling.
Figure 3
Figure 3
Energy use on different aspects of cerebellar computation. (A) Predicted energy use of the cerebellar cortex is poorly correlated with the firing of the Purkinje cells. Changes in the granule cell firing rate result in large changes in the predicted energy use. (B) Comparison of energy use by excitatory and inhibitory neurons. (C) Energy use on different stages of cerebellar computation.
Figure 4
Figure 4
Comparing the predicted laminar distribution of energy use with the observed distribution of blood vessels. (A) Cerebellar slice from a postnatal day 21 rat. The molecular layer (ML) and granular layer (GL) are labelled. (B) Predicted energy use in the molecular and granular layers. (C) Slice in A with blood vessels labelled with FITC-conjugated isolectin-B4 (projection image of a confocal z stack). (D) Measured distribution of blood vessel surface area (±s.e.m., n=3) between molecular and granular layers in 24 lobules from three rats. **P<0.02.

References

    1. Alle H, Geiger JR. Combined analog and action potential coding in hippocampal mossy fibers. Science. 2006;311:1290–1293. - PubMed
    1. Alle H, Roth A, Geiger JR. Energy-efficient action potentials in hippocampal mossy fibres. Science. 2009;325:1349–1351. - PubMed
    1. Attwell D, Gibb A. Neuroenergetics and the kinetic design of excitatory synapses. Nat Rev Neurosci. 2005;6:841–849. - PubMed
    1. Attwell D, Iadecola C. The neural basis of functional brain imaging signals. Trends Neurosci. 2002;25:621–625. - PubMed
    1. Attwell D, Laughlin SB. An energy budget for signaling in the grey matter of the brain. J Cereb Blood Flow Metab. 2001;21:1133–1145. - PubMed

Publication types

Substances

LinkOut - more resources