

Who infects whom? Social networks and tuberculosis transmission in wild meerkats
- PMID: 19889705
- PMCID: PMC2842696
- DOI: 10.1098/rspb.2009.1775
Who infects whom? Social networks and tuberculosis transmission in wild meerkats
Abstract
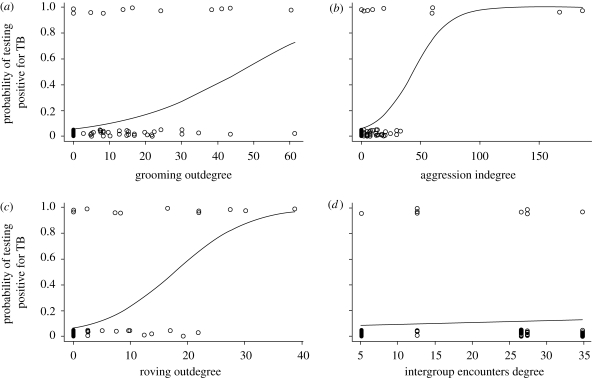
Transmission of infectious diseases is strongly influenced by who contacts whom. Despite the global distribution of tuberculosis (TB) in free-living wild mammal populations, little is known of the mechanisms of social transmission of Mycobacterium bovis between individuals. Here, I use a network approach to examine for correlations between five distinct types of intra- and intergroup social interaction and changes in TB status of 110 wild meerkats (Suricata suricatta) in five social groups over two years. Contrary to predictions, the most socially interactive animals were not at highest risk of acquiring infection, indicating that in addition to contact frequency, the type and direction of interactions must be considered when quantifying disease risk. Within social groups, meerkats that groomed others most were more likely to become infected than individuals who received high levels of grooming. Conversely, receiving, but not initiating, aggression was associated with M. bovis infection. Incidence of intergroup roving by male meerkats was correlated with the rovers themselves subsequently testing TB-positive, suggesting a possible route for transmission of infection between social groups. Exposure time was less important than these social interactions in influencing TB risk. This study represents a novel application of social network analysis using empirical data to elucidate the role of specific interactions in the transmission of an infectious disease in a free-living wild animal population.
Figures


References
-
- Altizer S., et al. 2003Social organization and parasite risk in mammals: integrating theory and empirical studies. Ann. Rev. Ecol. Evol. Syst. 34, 517–547 (doi:10.1146/annurev.ecolsys.34.030102.151725) - DOI
-
- Böhm M., Palphramand K. L., Newton-Cross G., Hutchings M. R., White P. C. L.2008Dynamic interactions among badgers: implications for sociality and disease transmission. J. Anim. Ecol. 77, 735–745 (doi:10.1111/j.1365-2656.2008.01377.x) - DOI - PubMed
-
- Borgatti S. P.1995Centrality and AIDS. Connections 18, 112–115
-
- Borgatti S. P.2005Centrality and network flow. Social Netw. 27, 55–71 (doi:10.1016/j.socnet.2004.11.008) - DOI
-
- Borgatti S. P., Everett M. G., Freeman L. C.2002UCInet for Windows: software for social network analysis. Harvard, MA: Analytic Technologies; Available at http://www.analytictech.com/ucinet6/ucinet.htm
Publication types
MeSH terms
LinkOut - more resources
Full Text Sources
Medical
