. 2010 Jan;84(2):1047-56.
doi: 10.1128/JVI.01535-09. Epub 2009 Nov 4.

Protective memory responses are modulated by priming events prior to challenge

Affiliations

Protective memory responses are modulated by priming events prior to challenge

John A Rutigliano et al. J Virol. 2010 Jan.

Abstract

Human infections with highly pathogenic H5N1 avian influenza A viruses in the last decade have legitimized fears of a long-predicted pandemic. We thus investigated the response to secondary infections with an engineered, but still highly virulent, H5N1 influenza A virus in the C57BL/6 mouse model. Mice primed with the H1N1 A/Puerto Rico/8/34 (PR8) virus were partially protected from lethality following respiratory infection with the modified H5N1 virus A/Vietnam/1203/04 (DeltaVn1203). In contrast, those that had been comparably exposed to the HKx31 (H3N2) virus succumbed to the DeltaVn1203 challenge, despite similarities in viral replication, weight loss, and secondary CD8(+)-T-cell response characteristics. All three viruses share the internal genes of PR8 that are known to stimulate protective CD8(+)-T-cell-mediated immunity. This differential survival of PR8- and HKx31-primed mice was also apparent for antibody-deficient mice challenged with the DeltaVn1203 virus. The relative protection afforded by PR8 priming was abrogated in tumor necrosis factor-deficient (TNF(-/-)) mice, although lung fluids from the B6 HKx31-primed mice contained more TNF early after challenge. These data demonstrate that the nature of the primary infection can influence pathological outcomes following virulent influenza virus challenge, although the effect is not clearly correlated with classical measures of CD8(+)-T-cell-mediated immunity.


Figures
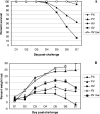
FIG. 1.
FIG. 1.
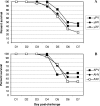
Severity of infection in mice challenged with H5N1 ΔVn1203 influenza virus. Mice were primed with 108 EID50 of PR8, x31, or ΔHK213 and then challenged with 106 EID50 of either x31 or ΔVn1203. Survival (A) was assessed by recording whether the mice succumbed to the infection. The data are a combination of all experiments, with a minimum of five experiments and 25 mice to begin the experiments. Kaplan-Meier survival probability estimates and Cox proportional hazards survival regression were used to determine significance between groups at all time points. Significant differences (P ≤ 0.05) were seen between PX and XV at days 5 (D5), 6, and 7; PX and PV at days 6 and 7; HV and XV at days 5, 6, and 7; HV and PV at day 6 and 7; and PV and XV at days 6 and 7. The mice were also weighed daily after the secondary infection to monitor illness, as defined by percent weight loss (B). The data are a single representative of at least five independent experiments, with five mice per group.
FIG. 2.
FIG. 2.
Viral replication in the lungs of mice challenged with H5N1 ΔVn1203 influenza virus. Mice were primed and challenged with virus as described for Fig. 1. Lungs were harvested and homogenized, and the supernatant was used in plaque assays on MDCK cells to determine virus titers. The data are a combination of multiple independent experiments, with 4 to 16 mice per group. P was <0.05 for the following comparisons: PX-PV, PX-HV, PX-XV, PV-HV, and HV-XV at day 3; PX-PV, PX-HV, PX-XV, PV-XV, PV-HV, and HV-XV at day 5; and PX-PV at day 7. ND, not done.
FIG. 3.
FIG. 3.
Survival of μMT and ABB mice after challenge with H5N1 ΔVn1203 influenza virus. B-cell-deficient μMT (A) and class II MHC-deficient ABB (B) mice were primed as described for Fig. 1 and then challenged with 106 EID50 of ΔVn1203. Survival was assessed by recording whether the mice succumbed to the infection. The data are a combination of all experiments, with a minimum of three experiments and 14 mice to begin the experiments. Kaplan-Meier survival probability estimates and Cox proportional hazards survival regression were used to determine significance between groups at all time points. No significant differences were noted.
FIG. 4.
FIG. 4.
Influenza virus-specific CD8+-T-cell inflammation after challenge with H5N1 ΔVn1203 influenza virus. B6 mice were primed and challenged as described for Fig. 1. Cells were isolated on day 5 and day 7 postchallenge from BAL (A and B), MLN (C and D), and spleens (E and F). Tetramer staining was used to measure the magnitude of influenza virus-specific CD8+-T-cell infiltration into the respective organs. The graph shows the number of CD8+ T cells that were positive for the DbNP366 (A, C, and E) and DbPA224 (B, D, and F) tetramers. The data are a single representative of at least five independent experiments, with five mice per group. P was <0.05 for the following comparisons: PX-XV and PX-XV low for DbNP366+ staining in the BAL at day 5 and PX-HV at day 7; PV-XV and PV-XV low for DbNP366+ staining in the MLN at day 5; PX-XV low and HV-XV low for DbNP366+ staining in the spleen at day 5; HV-XV low for PA224+ staining in the spleen at day5; HV-XV low for PA224+ staining in the MLN at day 7; PV-XV low and HV-XV low for PA224+ staining in the spleen at day 7.
FIG. 5.
FIG. 5.
Influenza virus-specific functional activation of CD8+ T cells after challenge with H5N1 ΔVn1203 influenza virus. On day 5 and day 7 postchallenge, cells were isolated from the BAL (A and B), MLN (C and D), and spleens (E and F). Functional activation was measured by intracellular cytokine staining for IFN-γ and TNF production by CD8+ T cells. The intensity of activation was determined by calculating the ratio of CD8+ T cells producing TNF to those producing only IFN-γ. (A, C, and E) Specific CD8+-T-cell activation after 5 h of in vitro stimulation with the immunodominant NP366-374 peptide epitope. (B, D, and F) Activation after stimulation with the PA224-233 peptide epitope. The data are a single representative of at least five independent experiments, with five mice per group. P was <0.05 for the following comparisons: PX-PV and PV-XV low in NP366-374-stimulated BAL at day 5 and PX-HV at day 7; PX-XV in NP366-374-stimulated MLN at day 5; HV-XV low in PA224-233-stimulated BAL at day 5; PX-XV low, PV-XV low, and HV-XV low in NP366-374-stimulated spleens at day 5; and PX-XV low, PV-XV low, and HV-XV low in PA224-233-stimulated spleens at day 7.
FIG. 6.
FIG. 6.
IFN-γ and TNF production by CD8 cells after challenge with H5N1 ΔVn1203 influenza virus. On day 5 and day 7 postchallenge, cells were isolated from the BAL and MLN. Antiviral cytokine production by unstimulated CD8 cells ex vivo was measured by intracellular cytokine staining for IFN-γ and TNF. The data are a single representative of at least five independent experiments, with five mice per group. P was <0.05 for the following comparisons: PV-XV low, HV-XV low, and XV-XV low for IFN-γ in the BAL at day 5 and PX-HV at day 7; PV-XV low, HV-XV low, and XV-XV low for TNF in the BAL at day 5; PX-XV, PV-XV, and HV-XV for IFN-γ in the MLN at day 5.
FIG. 7.
FIG. 7.
Antiviral cytokine concentration in BAL wash supernatants of mice challenged with H5N1 ΔVn1203 influenza virus. Mice were primed and challenged with influenza virus as described for Fig. 1. Luminex xMAP analysis was used to detect IFN-γ, TNF, IL-1α, IL-1β, MIP-1α, MIP-1β, MCP-1, MIG, IP-10, and IL-12p70 in BAL wash supernatants at day 3 and day 5 postchallenge. P was <0.05 for TNF and IFN-γ at day 3. The data are a representative of multiple experiments, with four to five mice per group.
FIG. 8.
FIG. 8.
Survival of TNF−/− and IFN-γ−/− mice after challenge with H5N1 ΔVn1203 influenza virus. Mice were primed with PR8 or x31 and then challenged with ΔVn1203 as described for Fig. 1. Survival was assessed by recording whether the mice succumbed to the infection. The survival data are a combination of all experiments, with at least 15 mice per group initially. Kaplan-Meier survival probability estimates and Cox proportional hazards survival regression were used to determine significance between groups at all time points. By Cox proportional hazards survival regression, P = 0.0558 for TPV versus GPV and 0.066 for TXV versus GXV.

References

    1. Aldridge, J. R., Jr., C. E. Moseley, D. A. Boltz, N. J. Negovetich, C. Reynolds, J. Franks, S. A. Brown, P. C. Doherty, R. G. Webster, and P. G. Thomas. 2009. TNF/iNOS-producing dendritic cells are the necessary evil of lethal influenza infection. Proc. Natl. Acad. Sci. U. S. A. 106:5306-5311. - PMC - PubMed
    1. Barry, J. M. 2004. The great influenza. The epic story of the deadliest plague in history. Viking, New York, NY.
    1. Belz, G. T., W. Xie, J. Altman, and P. C. Doherty. 2000. A previously unrecognized H-2Db-restricted peptide prominent in the primary influenza A virus-specific CD8+ T cell response is much less apparent following secondary challenge. J. Virol. 74:3486-3493. - PMC - PubMed
    1. Bender, B. S., T. Croghan, L. Zhang, and P. A. Small, Jr. 1992. Transgenic mice lacking class I major histocompatibility complex-restricted T cells have delayed viral clearance and increased mortality after influenza virus challenge. J. Exp. Med. 175:1143-1145. - PMC - PubMed
    1. Betts, M. R., M. C. Nason, S. M. West, S. C. DeRosa, S. A. Migueles, J. Abraham, M. M. Lederman, J. M. Benito, P. A. Goepfert, M. Connors, M. Roederer, and R. A. Koup. 2006. HIV nonprogressors preferentially maintain highly functional HIV-specific CD8+ T cells. Blood 107:4781-4789. - PMC - PubMed

Publication types

MeSH terms