. 2010 Jan 1;21(1):198-211.
doi: 10.1091/mbc.e09-07-0597. Epub 2009 Nov 4.

Growth-limiting intracellular metabolites in yeast growing under diverse nutrient limitations

Affiliations

Growth-limiting intracellular metabolites in yeast growing under diverse nutrient limitations

Viktor M Boer et al. Mol Biol Cell. .

Abstract

Microbes tailor their growth rate to nutrient availability. Here, we measured, using liquid chromatography-mass spectrometry, >100 intracellular metabolites in steady-state cultures of Saccharomyces cerevisiae growing at five different rates and in each of five different limiting nutrients. In contrast to gene transcripts, where approximately 25% correlated with growth rate irrespective of the nature of the limiting nutrient, metabolite concentrations were highly sensitive to the limiting nutrient's identity. Nitrogen (ammonium) and carbon (glucose) limitation were characterized by low intracellular amino acid and high nucleotide levels, whereas phosphorus (phosphate) limitation resulted in the converse. Low adenylate energy charge was found selectively in phosphorus limitation, suggesting the energy charge may actually measure phosphorus availability. Particularly strong concentration responses occurred in metabolites closely linked to the limiting nutrient, e.g., glutamine in nitrogen limitation, ATP in phosphorus limitation, and pyruvate in carbon limitation. A simple but physically realistic model involving the availability of these metabolites was adequate to account for cellular growth rate. The complete data can be accessed at the interactive website http://growthrate.princeton.edu/metabolome.


Figures
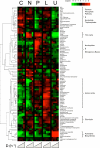
Figure 1.
Figure 1.
Clustered heat map of yeast metabolome variation as a function of growth rate and identity of the limiting nutrient. Rows represent specific intracellular metabolites. Columns represent different chemostat dilution rates (equivalent to steady-state cellular growth rates) for different limiting nutrients (C, limitation for the carbon source, glucose; N, limitation for the nitrogen source, ammonium; P, limitation for the phosphorus source, phosphate; L, limitation for leucine in a leucine auxotroph; U, limitation for uracil in a uracil auxotroph). Plotted metabolite levels are log2-transformed ratios of the measured sample concentration to the geometric mean concentration of the metabolite across all conditions. Data for each metabolite is mean-centered, such that the average log2(fold-change) across all samples is 0. Dilution rates increase within each condition from left to right from 0.05 to 0.3 h−1. Plotted values are the median of N = 4 independent samples from each chemostat.
Figure 2.
Figure 2.
Examples of metabolites that are potentially limiting growth under glucose limitation, ammonium limitation, phosphate limitation, and uracil limitation (from top to bottom). Metabolite concentrations are plotted on a log2 scale and mean-centered as per Figure 1. Values represent the median (black circles) and interquartile range (bars) of N = 4 independent samples from each chemostat. For a given limiting nutrient, steady-state growth rate increases from left to right from 0.05 to 0.3 h−1. Limiting nutrients are as per Figure 1: C, limitation for the carbon source, glucose; N, limitation for the nitrogen source, ammonium; P, limitation for the phosphorus source, phosphate; L, limitation for leucine in a leucine auxotroph; U, limitation for uracil in a uracil auxotroph. Trend lines are a fit to the linear model described in Figure 3.
Figure 3.
Figure 3.
Model-based determination of the nutrient mean effect and growth rate slope, using arginine as an example metabolite. Arginine concentration data (plotted using the same conventions as in Figure 2) were fit to Eq. 2; bn is the nutrient mean effect and mn is the growth rate slope. Units of the nutrient mean effect are log2(fold-change) and of the growth rate slope are log2(fold-change)/(growth rate). For example, a nutrient mean effect of −2 (as found for arginine in glucose limitation) implies that the average arginine concentration in glucose limitation is one-quarter (i.e., 2−2) the overall average. Once growth rate slope and nutrient mean effects are calculated, they can be plotted against each other (bottom right). Candidate growth-limiting metabolites have a negative nutrient mean effect and a positive growth rate slope, and accordingly fall in the top left quadrant. Overflow metabolites have a positive nutrient mean effect and negative growth rate slope, and accordingly fall in the bottom right quadrant. Compound-nutrient pairs are plotted when the nutrient mean effect and growth rate slope are both significant at FDR <0.1. For arginine, this occurred in nitrogen limitation and in carbon limitation but not in the other nutrient conditions. In both nitrogen limitation and carbon limitation, arginine showed a growth-limiting pattern.
Figure 4.
Figure 4.
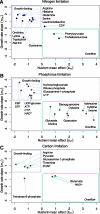
Growth-limiting and overflow metabolites. Data for all metabolites were fit to the model exemplified in Figure 3. Resulting plots of growth rate slope versus nutrient mean effect are shown here. (A) Nitrogen (ammonium) limitation. (B) Phosphorus (phosphate) limitation. (C) Carbon (glucose) limitation. For all plotted metabolites, both the growth rate slope and nutrient mean effect were significant (FDR <0.1). In each plot, candidate growth-limiting metabolites are found in the upper left quadrant, and overflow metabolites in the lower right quadrant.
Figure 5.
Figure 5.
Growth rate slope for amino acids under nitrogen limitation. The positive growth rate slope found for every amino acid implies that, under nitrogen limitation, each amino acid's intracellular concentration increases with faster cellular growth rate (i.e., with partial relief of the nitrogen limitation). Amino acids are abbreviated by standard single-letter code.
Figure 6.
Figure 6.
Adenylate energy charge across conditions and growth rates. Conventions are as per Figure 2: limiting nutrients are C, limitation for the carbon source, glucose; N, limitation for the nitrogen source, ammonium; P, limitation for the phosphorus source, phosphate; L, limitation for leucine in a leucine auxotroph; and U, limitation for uracil in a uracil auxotroph. Within each condition, steady-state growth rate increases from left to right from 0.05 to 0.3 h−1. Black circles represent the median of N = 4 independent samples from each chemostat. Absolute intracellular concentrations of ATP, ADP, AMP, and adenosine were ∼2.7, 0.6, 1.0, and 0.2 mM in the slowest-growing phosphorus-limited chemostats and 13, 0.8, 1.4, and 0.002 mM in the slowest-growing carbon-limited chemostats. Absolute concentrations in other conditions can be calculated from these values and the relative concentration data provided in Supplemental Dataset 1.
Figure 7.
Figure 7.
Metabolites with consistent growth rate responses across conditions. Conventions are as per Figure 2: limiting nutrients are C, limitation for the carbon source, glucose; N, limitation for the nitrogen source, ammonium; P, limitation for the phosphorus source, phosphate; L, limitation for leucine in a leucine auxotroph; and U, limitation for uracil in a uracil auxotroph. Within each condition, steady-state growth rate increases from left to right from 0.05 to 0.3 h−1. Metabolites were fit to the single-parameter model in Eq. 6, with mall representing the overall growth rate slope. The r values indicate goodness of fit. Note that orotate concentrations consistently increase with faster growth except under uracil limitation, where the knockout of URA3 causes the buildup of orotate.
Figure 8.
Figure 8.
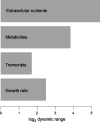
Dynamic range of extracellular and intracellular small molecules, transcripts, and cellular growth rate. Dynamic range refers to the maximum fold-change across all experiments. Reported values for nutrients, metabolites, and transcripts are the median across all measured species. For nutrients, the measured species are glucose (across all conditions), leucine (in leucine limitation), and uracil (in uracil limitation). Note that transcripts were measured by microarray; measurement by sequencing might yield a larger dynamic range.

References

    1. Abbott D. A., van den Brink J., Minneboo I. M., Pronk J. T., van Maris A. J. Anaerobic homolactate fermentation with Saccharomyces cerevisiae results in depletion of ATP and impaired metabolic activity. FEMS Yeast Res. 2009;9:349–357. - PubMed
    1. Auesukaree C., Tochio H., Shirakawa M., Kaneko Y., Harashima S. Plc1p, Arg82p, and Kcs1p, enzymes involved in inositol pyrophosphate synthesis, are essential for phosphate regulation and polyphosphate accumulation in Saccharomyces cerevisiae. J. Biol. Chem. 2005;280:25127–25133. - PubMed
    1. Avigad G. Stimulation of yeast phosphofructokinase activity by fructose 2,6-bisphosphate. Biochemical and biophysical research communications. 1981;102:7. - PubMed
    1. Bajad S. U., Lu W., Kimball E. H., Yuan J., Peterson C., Rabinowitz J. D. Separation and quantitation of water soluble cellular metabolites by hydrophilic interaction chromatography—tandem mass spectrometry. J. Chromatogr. A. 2006;1125:76–88. - PubMed
    1. Barford J. P., Hall R. J. Investigation of the significance of a carbon and redox balance to the measurement of gaseous metabolism of Saccharomyces cerevisiae. Biotechnol. Bioeng. 1979;21:609–626. - PubMed

Publication types

MeSH terms

LinkOut - more resources