Comparative Study
. 2009 Nov 4;29(44):14039-49.
doi: 10.1523/JNEUROSCI.2483-09.2009.

Inositol 1,4,5-trisphosphate 3-kinase a functions as a scaffold for synaptic Rac signaling

Affiliations
Comparative Study

Inositol 1,4,5-trisphosphate 3-kinase a functions as a scaffold for synaptic Rac signaling

Il Hwan Kim et al. J Neurosci. .

Abstract

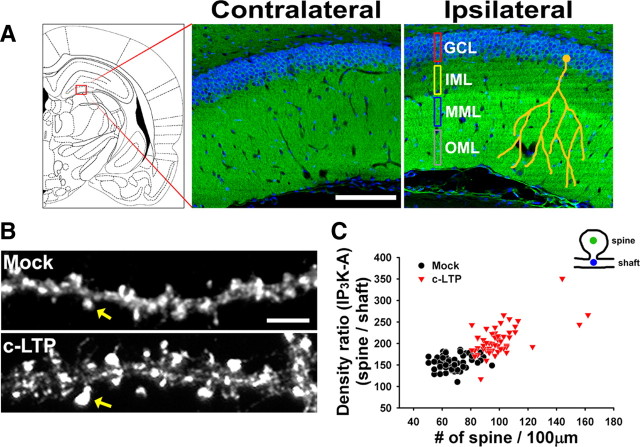
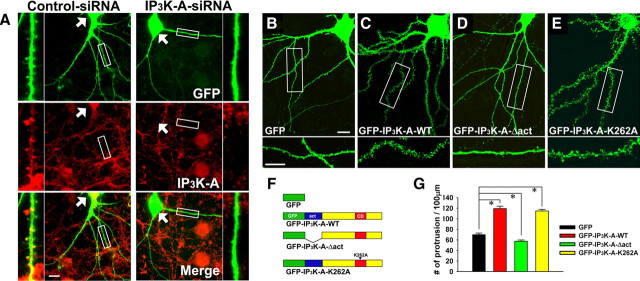
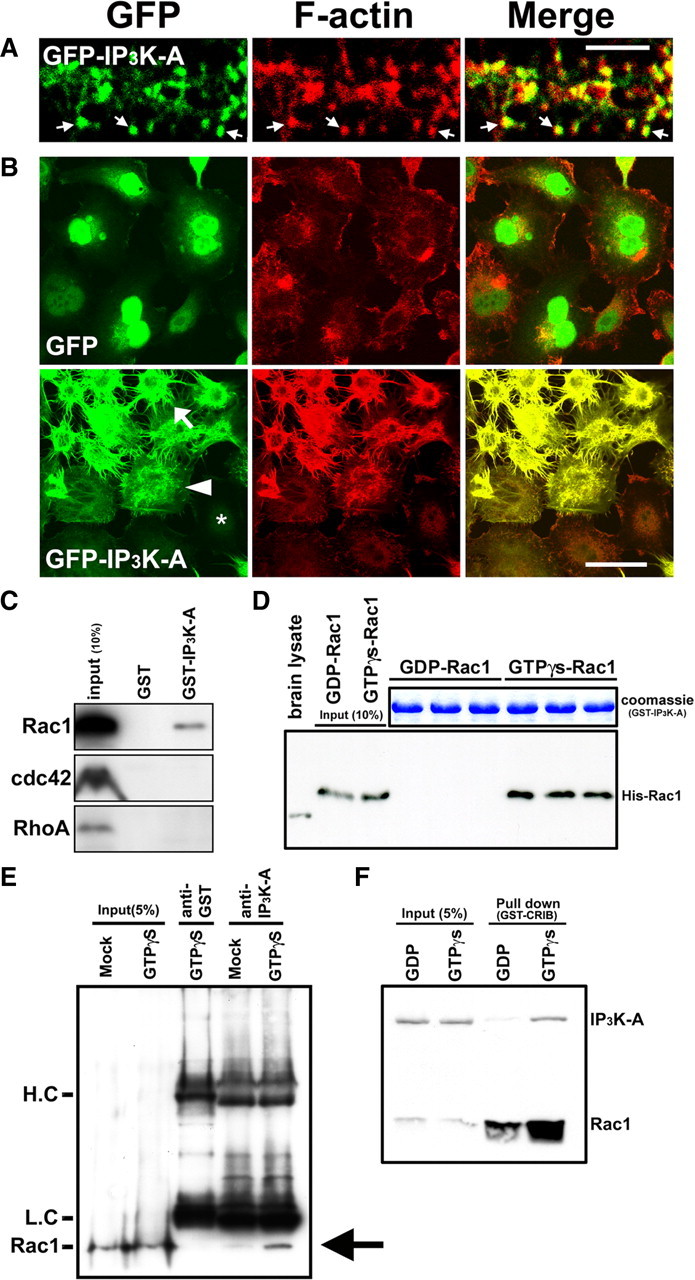
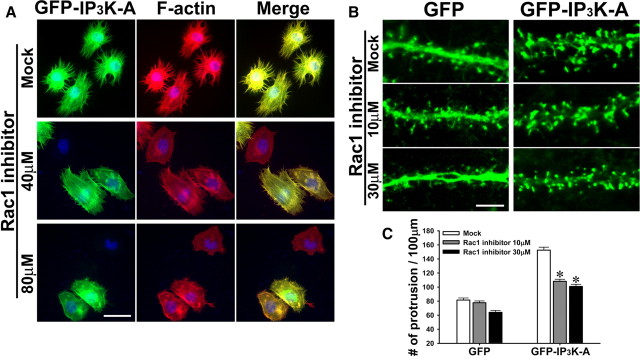
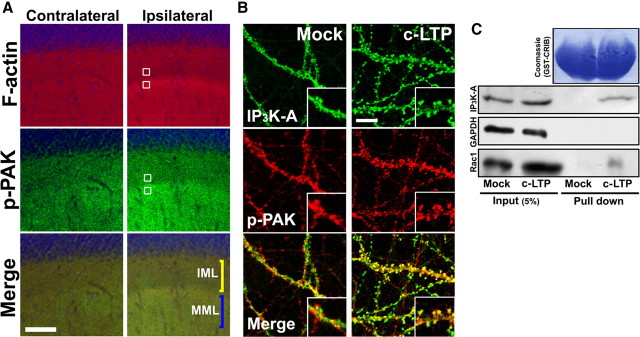
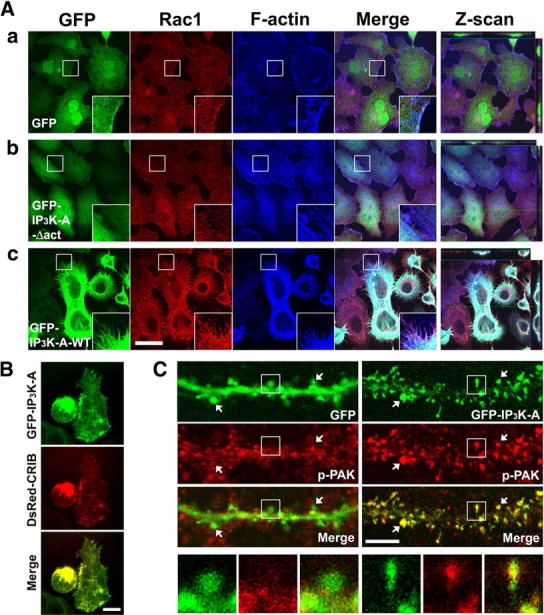
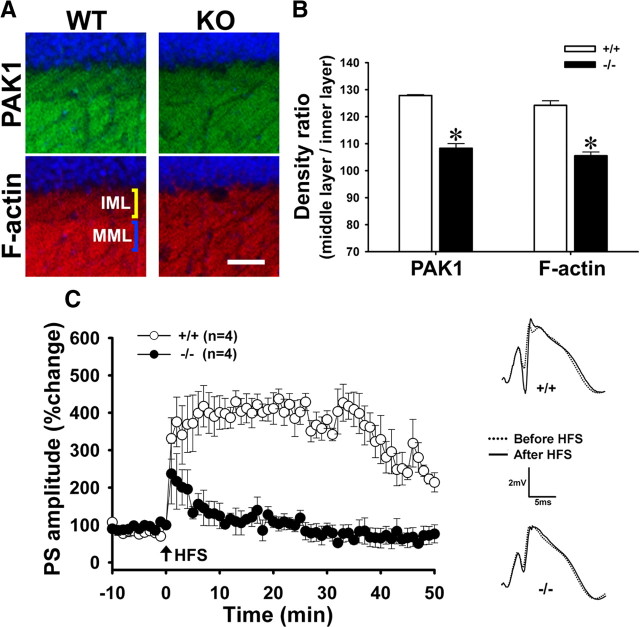
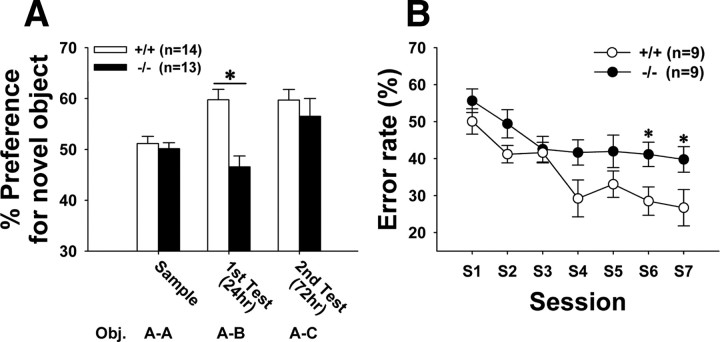
Activity-dependent alterations of synaptic contacts are crucial for synaptic plasticity. The formation of new dendritic spines and synapses is known to require actin cytoskeletal reorganization specifically during neural activation phases. Yet the site-specific and time-dependent mechanisms modulating actin dynamics in mature neurons are not well understood. In this study, we show that actin dynamics in spines is regulated by a Rac anchoring and targeting function of inositol 1,4,5-trisphosphate 3-kinase A (IP(3)K-A), independent of its kinase activity. On neural activation, IP(3)K-A bound directly to activated Rac1 and recruited it to the actin cytoskeleton in the postsynaptic area. This focal targeting of activated Rac1 induced spine formation through actin dynamics downstream of Rac signaling. Consistent with the scaffolding role of IP(3)K-A, IP(3)K-A knock-out mice exhibited defects in accumulation of PAK1 by long-term potentiation-inducing stimulation. This deficiency resulted in a reduction in the reorganization of actin cytoskeletal structures in the synaptic area of dentate gyrus. Moreover, IP(3)K-A knock-out mice showed deficits of synaptic plasticity in perforant path and in hippocampal-dependent memory performances. These data support a novel model in which IP(3)K-A is critical for the spatial and temporal regulation of spine actin remodeling, synaptic plasticity, and learning and memory via an activity-dependent Rac scaffolding mechanism.


Figures

Figure 1.
Figure 1.
IP3K-A accumulates in dendritic spines on LTP induction. A, Redistribution of IP3K-A in DG after in vivo LTP induction. One hour after the last tetanus in the perforant path, IP3K-A IR was observed by immunohistochemistry (green signal). Note the accumulation of IP3K-A IR in the spine-rich field of DG (MML and OML) only in the LTP-induced hemisphere (ipsilateral). The orange lines represent schematic illustration of a granule cell in DG. Blue signals, Nucleus. GCL, Granule cell layer; IML, inner molecular layer; MML, middle molecular layer; OML, outer molecular layer. Scale bar, 200 μm. B, Immunocytochemical assays showed an increase in density of dendritic spines after c-LTP induction. In c-LTP-treated neurons, endogenous IP3K-A was densely localized in spines by c-LTP induction (yellow arrows). Scale bar, 3 μm. C, Spine number was correlated with the mean value of the density ratio between dendritic spine and shaft (r = 0.726; p < 0.0001). Densitometry analysis revealed that neurons with a greater number of spines had more IP3K-A accumulated in those spines. The schematic figure indicates the calculating points for IP3K-A density in dendritic spine (green circle, spine; blue circle, shaft).
Figure 2.
Figure 2.
IP3K-A promotes dendritic spine formation. A, IP3K-A siRNA transfection (36 h) downregulated the expression of IP3K-A protein (red signals) and reduced the number of dendritic spines (green signals) of DIV 22 hippocampal neurons. High-magnification views showed that GFP signals of neurons transfected by control siRNA represented normal spine morphology, whereas those of IP3K-A siRNA-transfected neurons showed a markedly reduced spine density. The arrows indicate the cell bodies of control siRNA- and IP3K-A siRNA-transfected neurons, showing the absence of IP3K-A protein in IP3K-A siRNA-transfected neuron, but not in control siRNA-transfected neuron. Scale bar, 10 μm. B–E, Mature hippocampal neurons (DIV 22) were infected with adenovirus containing GFP or GFP fused to full-length IP3K-A (GFP-IP3K-A-WT), or an F-actin-binding domain deletion mutant of IP3K-A (GFP-IP3K-A-Δact), or a point mutant form of IP3K-A (GFP-IP3K-A-K262A) for 18 h. GFP-IP3K-A-WT overexpression dramatically increased the density of dendritic protrusions (C) compared with control GFP expression (B). Overexpressed GFP-IP3K-A-Δact was diffusely localized in neurons and did not change the morphology of dendritic spines (D). Overexpressed GFP-IP3K-A-K262A, which has no kinase activity, was primarily localized in protrusion heads with a protrusion density similar to that of overexpressed GFP-IP3K-A-WT (E). Scale bar, 10 μm. High-magnification view indicates that overexpressed GFP-IP3K-A was localized primarily in protrusion heads rather than shafts (C). Scale bar, 7 μm. F, The schematic figure indicates the regions of deletion domain or point mutation on IP3K-A. GFP, Enhanced GFP protein; act, actin-binding domain; CD, catalytic domain; K262A, point mutation at Lys262 to Ala. G, Quantification revealed that the number of dendritic protrusions was significantly increased in neurons with overexpressed GFP-IP3K-A-WT and GFP-IP3K-A-K262A, but was decreased by GFP-IP3K-A-Δact overexpression compared with neurons overexpressing GFP (F(3,201) = 90.03; Tukey's test, *p < 0.05). Data are presented as mean ± SEM.
Figure 3.
Figure 3.
IP3K-A influences actin dynamics and binds directly to only activated Rac1. A, Overexpressed GFP-IP3K-A (green) and F-actin (red) signals in neurons merged. The arrows indicate colocalized signals in heads of dendritic protrusions. Scale bar, 5 μm. B, Overexpressed IP3K-A signals (green) were perfectly merged with F-actin fibers (red) of HeLa cells. GFP-IP3K-A overexpression increased F-actin fibers, resulting in filopodia-like fiber formation. Note the expression gradient of GFP-IP3K-A; increased GFP-IP3K-A expression correlated with increases in filopodial F-actin fibers. Arrow, Strong expression; arrowhead, moderate expression; asterisk, weak expression of GFP-IP3K-A. Scale bar, 30 μm. C, GST pulldown assay with rat hippocampal P2 fraction by GST-IP3K-A. IP3K-A interacted with Rac1, but not with RhoA and cdc42. D, GST pulldown assay with purified His-Rac1 by GST-IP3K-A. Immunoblotting with anti-Rac1 antibody revealed that IP3K-A bound to GTPγs-bound purified Rac1 (active Rac1), but did not bind to GDP-bound Rac1 (inactive Rac1). Coomassie staining showed equal loading amounts of GST-IP3K-A proteins. E, Immunoprecipitation assay with rat hippocampal lysate showed that endogenous IP3K-A bound to endogenous Rac1. The addition of GTPγs to the lysate increased the amount of precipitated Rac1 compared with nontreated lysate group. Input lanes showed similar loading amounts of lysates. No Rac1 signal was detected in the control group that was precipitated by anti-GST antibody. Similar intensity of heavy and light chain band showed equal loading amounts of IP3K-A antibody. The arrow indicates Rac1 band. H.C, Heavy chain; L.C, light chain. F, GST-CRIB pulldown assay with GDP- or GTPγs-treated hippocampal lysate. Input lanes showed the equal amount of proteins used in each assays. Pulldown lanes showed that activated Rac1, pulled down with GST-CRIB, was increased by GTPγs treatment. Note that IP3K-A was co-pulled down with activated Rac1 in GTPγs-treated group.
Figure 4.
Figure 4.
Rac1 activity is essential for IP3K-A to exert its effects on dendritic spines. A, Rac1-specific inhibitor NSC23766 gradually blocked the IP3K-A expression-induced formation of filopodia in HeLa cells. After transfection of GFP-IP3K-A, HeLa cells were incubated for 24 h in medium containing the Rac1 inhibitor. Treatment with 40 μm NSC23766 mostly inhibited, and 80 μm treatment completely inhibited, the filopodia formation effect of IP3K-A. Scale bar, 30 μm. B, Treatment with NSC23766 (10 or 30 μm) mostly prevented IP3K-A overexpression from inducing formation of protrusions in DIV 22 hippocampal neurons. Scale bar, 7 μm. C, Quantification revealed that the increased dendritic protrusion number induced by IP3K-A overexpression was significantly inhibited by NSC23766 treatment. (F(2,194) = 65.2; Scheffé's test, *p < 0.05). Data are presented as mean ± SEM.
Figure 5.
Figure 5.
LTP induction activates Rac1 downstream events in dendritic spines. A, Distribution of p-PAK in DG after in vivo LTP induction. One hour after last tetanus, p-PAK as well as F-actin had accumulated in spine-rich field of DG (MML) only in the LTP-induced side. The white squares indicate the measure points for immunoreactivity. Scale bar, 100 μm. B, Representative images showing c-LTP-induced targeting of IP3K-A along with p-PAK into dendritic spines. High-magnification views showed colocalization of p-PAK with IP3K-A. Scale bar, 10 μm. C, GST-CRIB pulldown assay with c-LTP-induced P2 fraction of neurons. Input lanes showed that total Rac1 as well as IP3K-A in synaptosome seemed to be slightly increased in LTP-induced neurons, but levels of the control protein GAPDH did not seem to be different between the two groups. Pulldown lanes showed that activated Rac1 (GTP-Rac1), which was pulled down with GST-CRIB, was increased in LTP-induced neurons compared with that in the nontreated control group. IP3K-A was pulled down with activated Rac1. Coomassie staining showed equal loading amounts of GST-CRIB proteins.
Figure 6.
Figure 6.
IP3K-A recruits activated Rac1 onto F-actin fibers. Aa, When HeLa cells were infected by GFP-containing adenoviruses, Rac1 signals were evenly distributed in cells. Ab, Similar to GFP-infected cells, when infected by GFP-IP3K-A-Δact-containing adenoviruses, Rac1 signals rarely merged with F-actin signals. Ac, When infected by GFP-IP3K-A-WT, a large part of the Rac1 signal merged with the F-actin fiber signal. Z-scan image showed colocalization among Rac1, F-actin, and GFP-IP3K-A-WT. Scale bar, 30 μm. B, DsRed-CRIB, an activated Rac1-binding domain from PAK1, was colocalized with GFP-IP3K-A-WT in HeLa cells. Scale bar, 10 μm. C, The majority of p-PAK IRs was accumulated in heads of dendritic protrusions together with overexpressed full-length GFP-IP3K-A (right panels) compared with GFP-vector-expressing neuron (left panels). The arrows indicate heads of dendritic protrusions. Scale bar, 10 μm.
Figure 7.
Figure 7.
IP3K-A knock-out mice show defects in LTP and actin dynamics in dentate gyrus. A, Less PAK1 and F-actin was observed in the MML and OML of the DG in KO mice compared with WT mice. B, Densitometry analyses revealed the defect of KO mice in PAK1 and F-actin accumulation in the synaptic field of DG (MML) by neural activation (PAK1: t = 43.81, df = 4, *p < 0.0001; F-actin: t = 8.50, df = 4, *p < 0.001). Data are presented as mean ± SEM. C, In vivo LTP experiments of DG-perforant path showed that LTP of the population spike was disrupted in KO mice when compared with WT littermate mice (363.4 ± 8.6% for WT; 102.6 ± 5.9% for KO; paired t test; t = 29.5, df = 49, p < 0.0001). Data are mean ± SEM population spikes. Slopes are expressed as a percentage of the baseline recordings made 10 min before HFS. The right panel shows representative waveforms of both genotypes.
Figure 8.
Figure 8.
IP3K-A knock-out mice show defects in synaptic plasticity and memory performances. A, IP3K-A KO mice showed defects in novel object recognition. One day after a sample trial of an object recognition test, WT mice spent more time exploring a novel object (object B); however, exploration of a novel object by KO mice remained at the chance level (Scheffé's test, *p < 0.05). At a second choice test (exposure three times to object A), KO mice spent substantially more time on the new object C. Obj, Object. Data are presented as mean ± SEM. B, IP3K-A KO mice showed defects in spatial learning tasks. The error rates of KO mice at session 6 and 7 of the radial arm maze test were significantly higher than those of WT mice (*p < 0.05). Data are presented as mean ± SEM.

References

    1. Bliss TV, Collingridge GL, Morris RG. Introduction. Long-term potentiation and structure of the issue. Philos Trans R Soc Lond B Biol Sci. 2003;358:607–611. - PMC - PubMed
    1. Bonhoeffer T, Yuste R. Spine motility. Phenomenology, mechanisms, and function. Neuron. 2002;35:1019–1027. - PubMed
    1. Chen LY, Rex CS, Casale MS, Gall CM, Lynch G. Changes in synaptic morphology accompany actin signaling during LTP. J Neurosci. 2007;27:5363–5372. - PMC - PubMed
    1. Choi KY, Kim HK, Lee SY, Moon KH, Sim SS, Kim JW, Chung HK, Rhee SG. Molecular cloning and expression of a complementary DNA for inositol 1,4,5-trisphosphate 3-kinase. Science. 1990;248:64–66. - PubMed
    1. Dailey ME, Smith SJ. The dynamics of dendritic structure in developing hippocampal slices. J Neurosci. 1996;16:2983–2994. - PMC - PubMed

Publication types

Substances