. 2009 Dec 1;183(11):6922-32.
doi: 10.4049/jimmunol.0900582. Epub 2009 Nov 4.

NOD2 ligation subverts IFN-alpha production by liver plasmacytoid dendritic cells and inhibits their T cell allostimulatory activity via B7-H1 up-regulation

Affiliations

NOD2 ligation subverts IFN-alpha production by liver plasmacytoid dendritic cells and inhibits their T cell allostimulatory activity via B7-H1 up-regulation

Antonino Castellaneta et al. J Immunol. .

Abstract

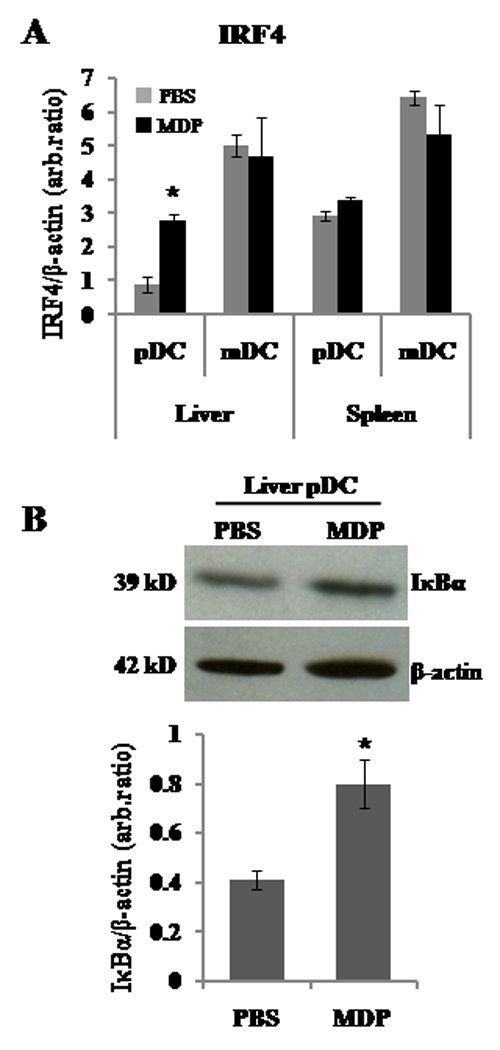
The nucleotide-binding oligomerization domain (NOD)2/CARD15 protein, which senses muramyl dipeptide (MDP), a product of bacterial peptidoglycan, appears to play an important role in regulating intestinal immunity. Although the liver is exposed to gut-derived MDP, the influence of NOD2 ligation on hepatic APC, in particular dendritic cells (DC), is unknown. Freshly isolated mouse liver and spleen plasmacytoid (p)DC expressed higher levels of NOD2 message than conventional myeloid (m)DC. Following MDP stimulation in vivo, liver pDC, but not mDC, up-regulated expression of IFN regulatory factor 4 (IRF-4), a negative regulator of TLR signaling, and induced less allogeneic T cell proliferation and IFN-gamma production. The adoptive transfer of liver pDC from MDP-treated mice failed to prime allogeneic T cells in vivo. By contrast, splenic DC IRF-4 levels and T cell stimulatory activity remained unchanged. Liver pDC from MDP-stimulated mice also displayed greater IkappaBalpha, cell surface B7-H1, and B7-H1 relative to CD86 than control liver pDC. No similar effects were observed for liver mDC or spleen DC. Absence of B7-H1 on liver pDC reversed the inhibitory effect of MDP. After ex vivo stimulation with LPS or CpG, liver pDC but not mDC from MDP-treated animals secreted less IL-12p70, IL-6, and TNF-alpha and induced weaker allogeneic T cell proliferation than those from controls. Moreover, CpG-stimulated liver pDC from MDP-treated mice secreted less IFN-alpha than their splenic counterparts, and systemic levels of IFN-alpha were reduced in MDP-treated animals after CpG administration. These findings suggest that differential effects of NOD2 ligation on liver pDC may play a role in regulating hepatic innate and adaptive immunity.


Figures

FIGURE 1
FIGURE 1
Freshly-isolated plasmacytoid (p)DC express higher levels of NOD2 message than myeloid (m) DC and in vivo treatment with MDP does not affect the number and proportion of liver and spleen DC subsets. Freshly-isolated, immunobead-purified liver and spleen pDC and mDC were isolated from C57BL/10 (B10) mice treated for 10 consecutive days with the endogenous DC poietin Flt3L (10µg/d, i.p.). A) mPDCA-1+ and mPDCA-1CD11c+ immunobead-purified cells were stained with anti-B220 and anti-CD11c mAbs. Flow cytometric analysis shows a purity >95% of liver and spleen CD11clowB220+ pDC and CD11c+B220mDC; B) DC subsets were analyzed for NOD2 relative to β-actin mRNA expression by semi-quantitative RT-PCR, as described in the Materials and Methods. Data are representative of three independent experiments, with two mice per group in each experiment. *p<0.004. For negative and positive control purposes, NOD2 expression was evaluated in a mouse D10 T cell line (Tc) and in normal mouse peritoneal macrophages (M), respectively. (C) Absolute number of Flt3L-expanded, freshly-isolated, immunobead-purified liver and spleen pDC and mDC from MDP-treated (100µg/d, i.p., 3 days) and control (PBS) mice. Data are representative of five independent experiments, with two mice per group in each experiment.
FIGURE 2
FIGURE 2
Freshly-isolated liver pDC from MDP-treated animals exhibit comparatively weak ability to induce allogeneic T cell proliferation and IFNγ production. Flt3L-expanded, freshly-isolated, immunobead-purified liver and spleen pDC and mDC from MDP (100µg/d, i.p., for 3 d)- or PBS-treated B10 mice were used as stimulators in 72 h MLR (responder cells: BALB/c bulk T cells). A) T cell proliferation was quantified by [3H]TdR incorporation. The proliferation of BALB/c T cells cultured alone (Neg control) and the responses of T cells stimulated with pDC or mDC isolated from CpG-ODN B (CpG)- or LPS-treated (LPS) mice (positive controls) are also shown. Data are representative of three independent experiments, with two mice per group in each experiment (*p<0.004). B) overall statistical analysis of three independent experiments showing the percentage of T cell proliferation induced by MDP-treated liver and spleen DC subsets relative to PBS-treated groups (*p<0.004). C) Supernatants from co-cultures of liver or spleen DC subsets from MDP- or PBS-treated B10 mice with BALB/c bulk T cells were harvested at 72 h and IFNγ levels quantified by ELISA. Data are representative of three independent experiments, with two mice per group in each experiment (*p<0.007 compared with MDP; NS: not significant).
FIGURE 3
FIGURE 3
Adoptive transfer of liver pDC from MDP-treated animals fails to prime allogeneic T cells in vivo. Flt3L-expanded liver or spleen pDC (2.106) from PBS- or MDP-treated B10 mice were injected i.v. into groups of 2–3 normal, allogeneic (BALB/c) recipients. Seven days later, proliferative responses of host bulk T cells (2.105) to stimulation with various numbers of B10 CD3 splenocytes were determined, as described in the Materials and Methods. For control purposes, proliferation of unprimed BALB/c bulk T cells stimulated by B10 CD3 splenocytes (Control) was tested. Results are means 1SD of triplicate cultures and are from one experiment representative of 2 performed. *p<0.01.
FIGURE 4
FIGURE 4
B7-H1 and B7-H1:CD86 (B7-2) MFI ratio on freshly-isolated liver pDC from MDP-treated animals correlates with inferior T cell stimulatory ability. Flt3L-expanded, freshly-isolated, immunobead-purified liver and spleen pDC and mDC from MDP (100µg/d, i.p., for 3 d)- or PBS-treated B10 mice were analyzed for (A) cell surface B7-H1 and (B) CD86 MFI by flow cytometry. C) overall analysis of three independent experiments, with two mice per group in each, showing the percentage change in B7-H1/CD86 ratio between MDP-treated and PBS control groups. D) T cell proliferation induced by liver pDC isolated from MDP (100µg/d, i.p., for 3 d)- or PBS-treated B7-H1−/− (KO) or wild-type (WT) control mice. The proliferation of BALB/c T cells cultured alone (Neg control) and the responses of T cells stimulated with pDC isolated from CpG-ODN B (CpG)-treated KO or WT mice (positive controls) are also shown. Data are representative of three independent experiments, with two mice per group in each experiment. (*p<0.01 compared with MDP WT; NS: not significant).
FIGURE 5
FIGURE 5
MDP stimulation in vivo is associated with upregulated expression of IRF4 and IκBα inhibitors in liver pDC. A) Flt3L-expanded, freshly-isolated, immunobead-purified liver and spleen pDC and mDC from MDP (100µg/d, i.p., for 3 d)- or PBS-treated B10 mice were analysed for IRF4/β-actin ratio by semi-quantitative real-time RT-PCR. Liver pDC isolated from MDP-treated mice showed a significantly higher level of IRF4 message than control liver pDC (*p<0.033). No significant differences were detected for liver mDC or spleen DC subsets. Data shown are representative of three independent experiments, with two mice per group in each experiment. B) Flt3L-expanded, freshly-isolated, immunobead-purified liver pDC from MDP (100µg/d, i.p., for 3 d)- or PBS-treated mice were analyzed for IκBα by Western blot analysis. In vivo MDP-preconditioned liver pDC exhibited a higher level of IκBα than control pDC (*p<0.05). GAPDH = housekeeping protein.
FIGURE 6
FIGURE 6
In vivo MDP stimulation impairs TLR4- and TLR9-induced T cell stimulatory activity of liver but not spleen pDC. Flt3L-expanded, freshly-isolated, immunobead-purified liver pDC from MDP (100µg/d, i.p., for 3 d)- or PBS-treated B10 mice were cultured overnight with LPS or CpG (1µg/ml) or culture media (CM) alone; after washing, the cells were used as stimulators in 72 h MLR (responder cells: BALB/c bulk T cells). A) T cell proliferation induced by freshly-isolated and overnight-cultured liver pDC (cultured in CM alone or LPS or CpG) was quantified by [3H]TdR incorporation. For control purposes, the proliferation of BALB/c T cells cultured alone was measured (Neg control). Data shown are representative of three independent experiments, with two mice per group in each experiment (*p<0.004: PBS/CM vs MDP/CM; †p<0.004: PBS/LPS vs MDP/LPS; ‡p<0.004: PBS/CpG vs MDP/CpG). B) overall statistical analysis of three independent MLR, showing the percentage of T cell proliferation induced by liver or spleen DC from the MDP-treated compared to PBS-treated groups (*p<0.004).
FIGURE 7
FIGURE 7
In vivo MDP stimulation reduces TLR4- and TLR9-induced IL-12 production by liver pDC. Flt3L-expanded, freshly-isolated, immunobead-purified liver pDC and mDC from MDP (100µg/d, i.p., for 3 d)- or PBS-treated B10 mice were cultured overnight with LPS (1µg/ml) or CpG (100 ng/ml) or culture media (CM) alone. Thereafter, supernatants and cells were harvested in order to detect IL-12p40/70 production by ELISA (A, C) and intracellular staining by flow cytometry (B, D). The top histograms of A and C show ELISA data from one experiment representative of three independent experiments, with two mice per group in each; in the lower histograms, the overall analysis of all three experiments is shown. B, D) Flow analysis results showing data of one representative experiment of three independent experiments, with two mice per group in each. (*p<0.01). ND = not detected.
FIGURE 8
FIGURE 8
In vivo MDP administration reduces TLR4- and TLR9-induced IL-6 and TNFα production by liver pDC. Flt3L-expanded, freshly-isolated, immunobead-purified liver pDC from MDP (100µg/d, i.p., for 3 d)- or PBS-treated B10 mice were cultured overnight with LPS or CpG (1µg/ml) or culture media (CM) alone. Thereafter, supernatants were harvested in order t o detect IL-6 and TNFα production by ELISA. Data shown are representative of three independent experiments, with two mice per group in each experiment. (*p<0.001). ND= not detected.
FIGURE 9
FIGURE 9
In vivo MDP stimulation reduces TLR9-induced IFNα production by liver pDC and systemic IFNα levels. A) Flt3L-expanded, freshly-isolated, immunobead-purified liver pDC from MDP (100µg/d, i.p., for 3 d)- or PBS-treated B10 mice were cultured overnight with CpG (1µg/ml) or culture media (CM) alone; thereafter, supernatants were harvested in order to detect IFNα secretion by ELISA. Data are representative of three independent experiments, with two mice per group in each experiment (*p<0.008). B) B10 mice were treated with the endogenous DC poietin Flt3L (10µg/mouse/day i.p., for 10 days) and either MDP (100µg/mouse/day i.p.) or PBS for the last 3 days of Flt3L treatment. Twenty four h later, mice were injected with CpG-ODN B (7.5µg/g, i.v.) and euthanized 6 h thereafter. Freshly-isolated, immunobead-sorted CD11clomPDCA1+ liver pDC were analyzed for IFNα:β-Actin mRNA ratio by real time RT-PCR (*p<0.002); C) serum IFNα levels were measured by ELISA (*p<0.005). ND = not detected.

References

    1. Banchereau J, Steinman RM. Dendritic cells and the control of immunity. Nature. 1998;392:245–252. - PubMed
    1. Morelli AE, Thomson AW. Dendritic cells: regulators of alloimmunity and opportunities for tolerance induction. Immunol Rev. 2003;196:125–146. - PubMed
    1. Steinman RM, Hawiger D, Nussenzweig MC. Tolerogenic dendritic cells. Annu Rev Immunol. 2003;21:685–711. - PubMed
    1. Sumpter TL, Abe M, Tokita D, Thomson AW. Dendritic cells, the liver, and transplantation. Hepatology. 2007;46:2021–2031. - PubMed
    1. Pillarisetty VG, Shah AB, Miller G, Bleier JI, DeMatteo RP. Liver dendritic cells are less immunogenic than spleen dendritic cells because of differences in subtype composition. J Immunol. 2004;172:1009–1017. - PubMed

Publication types

MeSH terms