. 2009 Dec;238(12):2975-3015.
doi: 10.1002/dvdy.22113.

Normal table of postembryonic zebrafish development: staging by externally visible anatomy of the living fish

Affiliations

Normal table of postembryonic zebrafish development: staging by externally visible anatomy of the living fish

David M Parichy et al. Dev Dyn. 2009 Dec.

Abstract

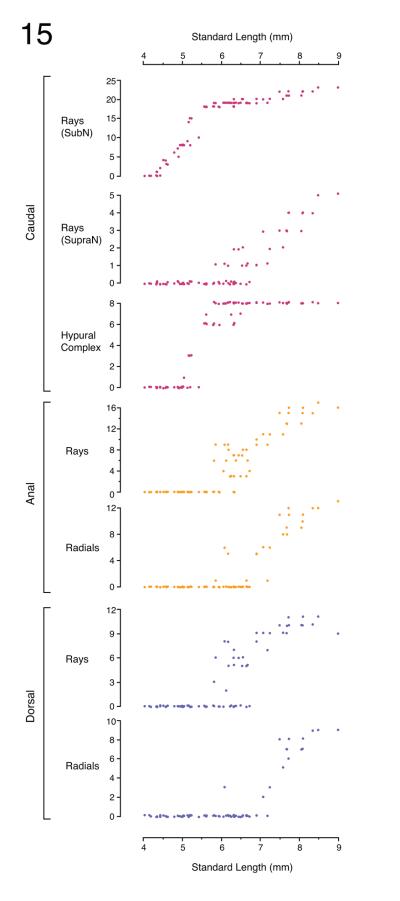
The zebrafish is a premier model organism yet lacks a system for assigning postembryonic fish to developmental stages. To provide such a staging series, we describe postembryonic changes in several traits that are visible under brightfield illumination or through vital staining and epiflourescent illumination. These include the swim bladder, median and pelvic fins, pigment pattern, scale formation, larval fin fold, and skeleton. We further identify milestones for placing postembryonic fish into discrete stages. We relate these milestones to changes in size and age and show that size is a better indicator of developmental progress than is age. We also examine how relationships between size and developmental progress vary with temperature and density, and we document the effects of histological processing on size. To facilitate postembryonic staging, we provide images of reference individuals that have attained specific developmental milestones and are of defined sizes. Finally, we provide guidelines for reporting stages that provide information on both discrete and continuous changes in growth and development.


Figures

Fig. 1
Fig. 1
Traits of post-embryonic zebrafish that are potentially useful for staging. SL, standard length. HAA, height at anterior of anal fin. FL°, flexion angle of notochord. aSB, swim bladder anterior lobe. pSB, swim bladder posterior lobe. Fins: A, anal; C, caudal; D, dorsal; P, pelvic. Scale, 1 mm.
Fig. 2
Fig. 2
External features of developing larvae and internal ossification of the same individuals revealed by calcein staining. Larvae are not to scale.
Fig. 3
Fig. 3
Growth varies markedly among larvae. Each trajectory shows consecutive SL for single fish reared individually (N=54) in three different batches. Left, trajectories between 3–280 dpf. Right, same trajectories expanded to show 3–84 dpf.
Fig. 4
Fig. 4
Size measurements are highly correlated. Shown are relationships for several easily measured characters relative to SL for larvae examined repeatedly through development. Relationships for nose–operculum length vs. SL, and eye diameter vs. SL, are slightly curvilinear, whereas the relationship of HAA vs. SL is curvilinear at small sizes (probably owing to the failure of small larvae to lay flat), but is reasonably linear at larger sizes. Larvae used for size measurements are the same individuals for which growth trajectories are shown in Fig 3.
Fig. 5
Fig. 5
Head development. Marked shape change occurs during the embryo–larval transition, with additional more subtle changes during later development. SL of individuals shown is in red at the lower left of each panel. Images shown are at decreasing magnifications. Scale bars: 3.4 and 9.6, 250 μm.
Fig. 6
Fig. 6
Ossification of craniofacial skeleton revealed by calcein staining. Lateral and ventral views are of the same individuals; different individuals are shown across stages (SL in lower right of each panel). All images are projections that flatten multiple focal planes. Selected skeletal elements are indicated with arrows (annotations are provided left to right in each panel unless otherwise noted; red arrow and regular type below = scored quantitatively; yellow arrow and italic type below = additional bones not scored). Overlays indicate skeletal units scored in Figure 7. A: 4.0, quadrate, hyomandibula, opercle, ceratobranchial 5; 5.0, ceratobranchial 2, ceratobranchial 3; 5.2, prootic, basioccipital; 7.2, lateral ethmoid, pterosphenoid; 7.8, supraorbital, sphenotic; 8.0, red overlay=dorso-orbital complex [DO1, lateral ethmoid; DO2, pterosphenoid, DO3, supraorbital], green overlay=notochord extension complex [NX1, basioccipital; NX2, prootic; NX3, sphenotic]; blue overlay=hyomandibula; yellow overlay=supraoccipital. B: 4.0, dentary, infraorbital, ceratohyal, hyomandibula (scored for lateral view); 5.0, ceratobranchial 4; 5.2, ventral hypohyals, basihyal; 6.2, urohyal; 8.0, infraorbital 1, dentary, ceratohyal, yellow overlay=basihyal, red overlay=ventral hypohyals, green overlay=branichiostegal ray complex [BR, branchiostegal rays], blue overlay=urohyal.
Fig. 7
Fig. 7
Ossification progress by SL. Shown are scores for defined lateral and ventral units of the craniofacial skeleton revealed by calcein staining. All scores are jittered vertically for clarity, except for length of the proximal branchiostegal ray (bottom). Each point represents the value for an individual fish of the indicated SL. Scoring was based on the following criteria, with 0 always indicating an absence of staining; the onset of calcein staining for individual bones is indicated by “+” in the following, when more qualitative descriptions are not given: dorso-orbital complex, 1=lateral ethmoid+, 2=pterosphenoid+, 3=supraorbital+; notochord extension complex, 1=basioccipital+, 2=prootic+, 3=sphenotic+ (begins to extend medial-dorsally into a single rounded end), 4=sphenotic++(staining widens into two rounded ends); hyomandibula, 1=staining in narrow ring, 2=expansion of staining into dorsal process of bone, 3=expansion of staining into ventral process and widening of dorsal process; supraoccipital, 1=first appearance, 2=posterior elongation and lateral curvature; basihyal, 1=first appearance; ventral hypohyals, 1=first bone ossified, 2=second bone ossified; branchiostegal ray complex, scores indicate number of bones stained [paired branchiostegal rays plus paired subopercles; while generally there are only three pairs of branchiostegal rays, some individuals exhibit four pairs (Cubbage and Mabee 1996)]; urohyal, anterior–posterior length of stained region, with no staining=0.
Fig. 8
Fig. 8
Notochord flexion in a single individual. In each panel, degrees of flexion are shown at the lower left and corresponding SL at the lower right. As the notochord bends, the rate of SL increase drops briefly (e.g., 15–23°).
Fig. 9
Fig. 9
Relationships between SL and notochord angle of flexion, swim bladder characteristics, and pelvic fin bud appearance in larvae examined repeatedly through development. Shown above is approximate HAA relative to SL as predicted in Figure 4 and Table 3. The meristic traits, swim bladder lobes and pelvic fin buds, are jittered for clarity of presentation.
Fig. 10
Fig. 10
Changes in swim bladder morphology. Shown is a single individual, viewed from ventrolaterally (SL at lower right of each panel). Larvae initially have a single, posterior swim bladder lobe. A second, anterior lobe appears as a bud adjacent to the posterior lobe, then inflates within a short period of time. Images shown are at decreasing magnifications. Scale bars: 6.1 and 7.9, 250 μm.
Fig. 11
Fig. 11
Early caudal fin development. Shown are multiple individuals with corresponding SL in the lower right of each panel. Arrowheads: 4.5, mesenchymal condensation at base of prospective fin; 4.9, fully formed caudal fin ray first segments; 5.0, division between future dorsal and ventral fin rays (also apparent at 4.9). Arrows: 6.0, joints between first and second segments of indicated rays. 6.4, joints between first, second, and third segments of indicated ray. Images shown are at decreasing magnifications. Scale bars: 3.5 and 6.4, 250 μm.
Fig. 12
Fig. 12
Relationships between fin characteristics and SL in larvae examined repeatedly through development. Above, number of fin rays observed in each of the indicated fins. Below, number of fin ray segments in the longest ray within each fin. All values are meristic and jittered for clarity. Pectoral fins were not scored.
Fig. 13
Fig. 13
Late caudal fin development and pigment pattern formation. Shown is a single individual (SL at lower left of each panel). An initially rounded fin gradually develops a middle cleft with longer lobes dorsally and ventrally. Emergence of the fin pigment pattern proceeds from an initially uniform field of melanophores, to the development of interspersed xanthophores, and subsequent segregation into the definitive adult stripes (see text for details). Arrow in 10.1: transiently disjunct melanophore stripes on body and fin. 1V, adult ventral primary melanophore on body. M1, first arising caudal fin melanophore stripe; M2d, M2v, second arising dorsal and vental caudal fin melanophore stripes; X1d, X1v, first arising caudal fin xanthophore interstripes. Images shown are at decreasing magnifications. Scale bars: 6.1 and 34.8, 0.5 mm.
Fig. 14
Fig. 14
Ossification progress of caudal complex revealed by calcein staining. Shown are mutliple individuals (SL in lower right of each panel). Annotations for arrows are provided left to right for each panel; overlays are units scored in Figure 15. 4.6, posteriormost ossified centrum, first ossifying ray segment; 5.0, first segments of multiple ossified fin rays; 5.2, hypurals; 7.2, supranotochordal fin rays; 8.5, c=centra, pu=preural, hspu=hemal spines from preural, phy=parahypural, hy=hypural, green overlay=terminal centra complex [6 posterior centra and both preural (pu) 2 and 3 of the vertebral column]; blue overlay=hypural complex [hypurals (hy) 1–5, parahypural (phy), and the hemal spines (hspu) originating from pu2 and pu3], orange overlay=supranotochordal rays [dorsal procurrent rays appearing dorsal to the notochord], pink overlay=subnotochordal rays [including the principal caudal rays of the dorsal and ventral lobes and the ventral procurrent rays that are supported by hspu2, hspu3 and phy]. Terminal centra counts (shown in Fig. 20) are best performed posterior-to-anterior with hspu2 and hspu3 serving as landmarks for their corresponding centra; staining for these hemal spines occurs prior to staining of centra. At earlier stages, the terminal somite boundaries can be used to identify segments corresponding to pu2 and pu3.
Fig. 15
Fig. 15
Ossification progress for median fins by SL. All scores are jittered vertically for clarity. Scoring was based on the following criteria: caudal fin rays (subnotochordal and supranotochordal), simple counts; hypural complex, count of total bones stained (see Figure 14 legend); dorsal and anal fin rays and radials, simple counts.
Fig. 16
Fig. 16
Early dorsal and anal fin development. Shown is a single individual (SL at lower right of each panel). Arrowheads: 5.2, anal fin condensation; 5.4, melanophore (arrow, bulge in fin fold presages dorsalfin condensation); 5.5, condensing anal fin radials; 5.7, dorsal fin condensation; 6.3, anal fin rays; 7.0, dorsal fin rays. Images shown are at decreasing magnifications. Scale bars: 5.3 and 7.0, 250 μm.
Fig. 17
Fig. 17
Late dorsal and anal fin development and pigment pattern formation. A single individual is shown at multiple sizes (SL at lower left of each panel). Arrowheads: 6.1, first melanophores in dorsal and anal fins; 6.5, xanthophore appearance in anal fin; 16.0, intermingled melanophores and xanthophores persist distally in anal fin. M1, M2, first and second anal fin melanophore stripes; X1, first anal fin xanthophore interstripe. Images shown are at decreasing magnifications. Scale bars: 6.1, 250 μm; 16.0, 500 μm.
Fig. 18
Fig. 18
Calcein staining reveals anal fin ray and radial ossification. Multiple individuals are shown (SL at lower right).
Fig. 19
Fig. 19
Calcein staining reveals dorsal fin ray and radial ossification. Multiple individuals are shown (SL at lower right). 5.8, arrows show initial ossification of rays.
Fig. 20
Fig. 20
Quantification of terminal centra and pleural rib ossification. Both are simple counts (see also legend of Fig. 14).
Fig. 21
Fig. 21
Ossification of pleural ribs and pelvic fin rays revealed by calcein staining. Multiple individuals (SL at lower right).
Fig. 22
Fig. 22
Pelvic fin development and fin fold minor lobe regression. Shown is a single individual (SL at lower right). A: Low magnification views showing minor fin fold (arrowheads), vent, and anal fin. Subtle resorption of the minor fin fold is first apparent in this individual at ~9.1 mm SL (arrowhead), and is clearly underway by 9.3 mm SL, when distal tips of the pelvic fins eclipse the edge of the fin fold; only small remnants of fin fold are present anterior to the vent at 9.8 mm SL (arrowhead) and 10.2 mm SL. B: Details of developing pelvic fin bud, first apparent in this individal at 7.5 mm SL (arrow). The bud extends from the body wall (8.3 mm SL), and three fin rays each comprising single developing segments are apparent by 8.8 mm SL (arrows). Second segments (large arrow) and the first joint between segments (small arrow) are clearly visible by 10.2 mm SL. Images shown are at decreasing magnifications. Scale bars: 7.5 and 10.2, 0.5 mm.
Fig. 23
Fig. 23
Larval fin fold and fin fold resorption. Multiple individuals are shown (SL at lower right). 3.4, Initial shapes of fin fold major lobe (arrowheads) and minor lobe (arrow); 4.2, a constriction is evident at the posterior tail (arrowhead); 5.6, a bulge is evident in the dorsal fin fold above the dorsal fin mesenchymal condensation (arrowhead); 6.4, a notch posterior to the dorsal fin indicates early fin fold resorption (arrowhead) and a bulge is evident over the developing supranotochordal fin rays (arrow); 6.8, resorption continues both anterior and posterior to the dorsal fin (arrowheads); 7.7, resorption occurs in an increasingly posterior zone along the tail (arrowheads); 8.3, early resorption of the minor lobe is revealed by flattening of its ventral posterior margin (arrowhead; also see Fig. 22).
Fig. 24
Fig. 24
Scale development revealed by transmitted illumination. A single individual is shown (SL at upper right). 8.9, An initially smooth dorsum. 9.6, onset of posterior squamation is indicated by the appearance of raised ridges (arrow); 9.9, scales are well-formed posteriorly (arrowheads) and are starting to develop anteriorly (arrow); 12.0, scales are completed anteriorly (arrowheads).
Fig 25
Fig 25
Body melanophore pattern. A: Pigment pattern metamorphosis in a single individual (SL at lower right) with qualitative scores assigned to each melanophore pattern state adjacent at lower left. Development is bottom-to-top, matching the plot in B. 1, At the onset of pigment pattern metamorphosis, a few metamorphic melanophores are scattered over the myotomes (boxed region shown at higher magnification in panel B, with metamorphic melanophores marked by arrows). 2, metamorphic melanophores are widely scattered over the flank, with residual embryonic/early larval melanophores at the horizontal myoseptum (arrow). 3, Adult melanophore stripes begin to be apparent (arrowheads) bordering an increasingly melanophore-free interstripe. Horizontal bars indicate the horizontal myoseptum. 4, Stripes are increasingly distinct as gaps are filled. 5, A juvenile pigment pattern comprising the first two primary adult stripes (1D, 1V) and a first secondary stripe (2V), as well as melanophores covering the dorsum and scales (arrowhead). B: Relationship between melanophore pattern and SL. Fish were placed into the classes represented by panels in A, or intermediate to these classes. Points are jittered vertically for clarity.
Fig. 26
Fig. 26
Development of melanophore pattern on scales. Shown are multiple individuals (SL at lower left). Melanophores are organized along the outlines of scales initially (10.7) and are subsequently found along the distal edge of each scale (15.4, arrowhead). The body melanophore stripe 2D (16.0, arrow) appears beneath the scales. Images shown are at decreasing magnifications. Scale bars: 10.7 and 22.9, 0.5 mm.
Fig. 27
Fig. 27
Development of iridophore pattern. Shown are multiple individuals (SL at lower right). A: Development of iridophores in the nascent interstripe of the anterior trunk. 4.5, iridophores are first present only internally, covering the swim bladder (arrowhead). 5.0, iridophores immediately under the skin first arise near the swim bladder, over the ventral-lateral surfaces of a few myotomes. 5.7–7.3, the initial patch spreads more posteriorly (arrowheads indicate posterior-most reflective cells). B: A continuous iridophore interstripe is formed as cells in the anterior become contiguous with a patch at the base of the the tail. C: Development of iridophore patch near the site of notochord flexion (anteriormost reflecting cells indicated by arrowheads).
Fig. 28
Fig. 28
Lateral line development revealed by labeling with vital fluorescent dye FM1-43. Shown are multiple individuals in brightfield (left) and inverted epifluorescence (right; SL at lower right). 3.5, Neuromasts of the posterior lateral line (arrowheads), with a cluster near the base of the tail; additional neuromasts are visible on the contralateral side. 5.8, Additional neuromasts have arisen between pre-existing neuromasts of the main lateral (L) line (arrowhead) whereas caudal neuromasts are found in an increasingly vertical line at the base of the caudal fin (arrow). 7.4, Neuromasts are apparent within the secondary lateral (L’) line (arrowhead) and at the base of the dorsal fin (arrow). 8.6, Additional neuromasts are seen in the seconday lateral (L’) line (arrowheads) and on the caudal fin itself (arrow).
Fig. 29
Fig. 29
Rearing temperature has subtle effects on the relationship between SL and other traits. Shown are prediction plots from multiple logistic regressions for transitions in swim bladder, dorsal fin, and pelvic fin development. Probabilities indicate the likelihood that an individual of a particular SL will exhibit a particular developmental state, depending on rearing temperature. Trait-specific states are indicated within each plot.
Fig. 30
Fig. 30
Temperature and rearing density affect transitions in melanophore pattern. See Figure 29 legend and text for additional details.
Fig 31
Fig 31
Effect of histological processing on SL (upper plot) and HAA (lower plot). Fish were either fixed or mock-processed for in situ hybridization (ISH). Regressions reported in Table 3.
Fig. 32
Fig. 32
Embryonic pec fin stage of Kimmel et al. (1995); 3.4 mm SL. A,A’: Whole body. Arrowhead, melanophores covering yolk ball. Scale, 1 mm. B: Head. C: Swim Bladder, not yet inflated. C,C’: Tail. Arrow, gap in melanonophore pattern corresponding to region of caudal fin condensation.
Fig. 33
Fig. 33
Inflation of posterior swim bladder lobe; pSB, 3.5 mm SL. A,A’: Whole body. Scale, 1 mm. B,B’: Head. C: Anterior trunk showing inflated swim bladder (arrow) and covering iridophore patch (arrowhead). D,D’: Posterior trunk showing definitive early larval melanophore and xanthophore pattern. E: Caudal region, highlighting complete fin fold. Arrowhead, gut. F,F’: Posterior tail. Arrow, caudal fin condensation and gap in melanophore stripe.
Fig. 34
Fig. 34
Following inflation of posterior swim bladder lobe; pSB+, 3.8 mm SL. A,A’: Whole body. Scale, 1 mm. B,B’: Head showing more anterior mouth position (arrowhead). C: Anterior trunk. D,D’: Posterior trunk. E: Caudal region. F,F’: Posterior tail.
Fig. 35
Fig. 35
Early flexion; FLe, 4.5 mm SL. A,A’: Whole body. Scale, 1 mm. B,B’: Head. C: Anterior trunk showing swim bladder. D,D’: Posterior trunk and pigment pattern. E: Caudal region. F,F’: Posterior tail. Arrow, caudal fin condensation is increasingly pronounced.
Fig. 36
Fig. 36
Caudal fin ray appearance; CR, 4.9 mm SL. A,A’: Whole body. Scale, 1 mm. B,B’: Head. C: Anterior trunk. D,D’: Posterior trunk. Xanthophore pigment is now less pronounced. E: Caudal region. F,F’: Posterior tail. Arrow, first fin rays of caudal fin.
Fig. 37
Fig. 37
Anal fin condensation; AC, 5.4 mm SL. A,A’: Whole body. Scale, 1 mm. B,B’: Head. C: Anterior trunk. D,D’: Posterior trunk showing condensed mesenchyme of prospective anal fin (arrow). E: Caudal region. F,F’: Posterior tail.
Fig. 38
Fig. 38
Dorsal fin condensation; DC, 5.7 mm SL. A,A’: Whole body. Scale, 1 mm. B,B’: Head. C: Anterior. Arrowhead, iridophores cover ventral–lateral face of myotomes in anterior trunk. D,D’: Posterior trunk showing dorsal fin condensation (arrow). E: Caudal region. F,F’: Posterior tail. The fin is flattened at its end and melanophores are widely scattered amongst fin rays.
Fig. 39
Fig. 39
Following dorsal fin condensation; DC+, 5.8 mm SL. A,A’: Whole body. Scale, 1 mm. B,B’: Head. C: Anterior. D,D’: Posterior trunk showing dorsal fin condensation and melanophores adjacent to the ventral fin condensation (arrow). E: Caudal region. F,F’: Posterior tail.
Fig. 40
Fig. 40
Metamorphic melanophore appearance; MMA, 5.9 mm SL. A,A’: Whole body. Scale, 1 mm. B,B’: Head. C: Anterior, showing first metamorphic melanophore over ventrolateral myotome (arrow in inset). D,D’: Posterior trunk, where metamorphic melanophores have not yet arisen. E: Caudal region. F,F’: Posterior tail.
Fig. 41
Fig. 41
Inflation of anterior swim bladder lobe; aSB, 6.0 mm SL. A,A’: Whole body. Scale, 1 mm. B: Head. C,C’: Anterior trunk showing newly inflated anterior lobe of swim bladder (arrow). D,D’: Posterior trunk. Arrow, developing radials of caudal fin. E: Caudal region. F,F’: Posterior tail.
Fig. 42
Fig. 42
Following inflation of anterior swim bladder lobe; aSB+, 6.1 mm SL. A,A’: Whole body. Scale, 1 mm. B: Head. C,C’: Anterior trunk showing newly inflated anterior lobe of swim bladder (arrow). D,D’: Posterior trunk.. E: Caudal region. F,F’: Posterior tail showing developing cleft (arrowhead) between dorsal and ventral lobes of caudal fin.
Fig. 43
Fig. 43
Anal fin ray appearance; AR, 6.2 mm SL. A,A’: Whole body. Scale, 2 mm. B,B’: Head. C: Anterior showing distinct swim bladder lobes and overlying iridophores. D,D’: Posterior trunk. Iridophores form a thin line ventral to the myoseptum (arrow in D). First segments of anal fin rays are now evident distal to the radials (arrow in D’). E: Caudal region showing signs of fin fold resorption. F,F’: Posterior tail, showing iridophore patch at tip of tail (arrow).
Fig. 44
Fig. 44
Following anal fin ray appearance, AR+, 6.3 mm SL. A,A’: Whole body. Scale, 2 mm. B,B’: Head. C: Anterior trunk. Inset, metamorphic melanophores over middle trunnk D,D’: Middle trunk with dorsal and ventral fins. Arrow, condensing mesenchyme will form dorsal fin rays, which are not yet fully formed. Arrowhead, notch in fin fold. E: Posterior trunk. F,F’: Posterior tail.
Fig. 45
Fig. 45
Dorsal fin ray appearance; DR, 6.4 mm SL. A,A’: Whole body. Scale, 2 mm. B,B’: Head. C: Anterior trunk. Inset, individual metamorphic melanophores over ventrolateral myotomes just posterior to the posterior swim bladder lobe. D,D’: Middle trunk with dorsal and ventral fins. Arrow, dorsal fin rays. E: Posterior trunk. F,F’: Posterior tail.
Fig. 46
Fig. 46
Following dorsal fin ray appearance; DR+, 6.6 mm SL. A,A’: Whole body. Scale, 2 mm. B,B’: Head. C: Anterior trunk. D,D’: Middle trunk. E: Posterior trunk. F,F’: Posterior tail.
Fig. 47
Fig. 47
Pelvic fin bud appearance; PB, 7.2 mm SL. A,A’: Whole body. Scale, 2 mm. B: Posterior trunk. C: Anterior trunk. Metamorphic melanophores are present but not fully melanized (e.g., arrows). D,D’: Ventral region showing pelvic fin bud (arrow). E,E’: Middle trunk showing dorsal and anal fins as well as pigment pattern. Arrowhead, region of fin fold resorption. F,F’: Detail of dorsal fin. G,G’: Detail of caudal fin. H,H’: Detail of anal fin.
Fig. 48
Fig. 48
Following pelvic fin bud appearance; PB+, 7.6 mm SL. A,A’: Whole body. Scale, 2 mm. B,B’: Head. C,C’: Anterior and middle trunk showing pelvic fin bud (arrow). D: Pelvic fin bud showing condensed mesenchyme without rays. E,E’: Middle trunk showing dorsal and anal fins as well as pigment pattern. Metamorphic melanophores are more fully melanozed and are scattered over the flank (e.g, arrow). F: Posterior trunk showing resorption of fin fold and extended line of iridophores (arrow) beneath the horizontal myoseptum. G,G’: Dorsal fin, showing xanthophores in addition to melanophores. H,H’: Caudal fin. I,I’: Detail of anal fin.
Fig. 49
Fig. 49
Pelvic fin ray appearance; PR, 8.5 mm SL. A,A’: Whole body. Scale, 2 mm. B,B’: Head. C: Anterior and middle trunk. D,D’: Pelvic fin with first rays (arrow) as well as minor lobe of fin fold and site of resorption (arrowhead). E,E’: Middle trunk showing dorsal and anal fins and pigment pattern. Residual embryonic/early larval melanophores occur near the horizontal myoseptum (arrow). F,F’: Dorsal fin. G,G’: Caudal fin, showing emergence of first stripes. H,H’: Anal fin.
Fig. 50
Fig. 50
Following pelvic fin ray appearance; PR+, 9.2 mm SL. A,A’: Whole body. Scale, 2 mm. B,B’: Head. Arrowhead indicates developing barbel. C: Anterior and middle trunk. D,D’: Pelvic fin. E,E’: Middle trunk. F,F’: Dorsal fin. G,G’: Caudal fin. H,H’: Anal fin.
Fig. 51
Fig. 51
Onset of posterior squamation; SP, 9.8 mm SL. A,A’: Whole body. Scale, 2 mm. B,B’: Detail of head. C: Dorsal flank showing absence of scales anterior to dorsal fin. D: Posterior tail, showing raised ridges of scales dorsally and ventrally (arrowheads). E,E’: Middle trunk showing dorsal and anal fins and pigment pattern. Stripes are increasingly distinct except for a few remaining gaps (arrowhead) and fewer embryonic/early larval melanophores are found in the interstripe region (arrow). F,F’: Dorsal fin. G,G’: Caudal fin, with increasingly distinct stripes. H,H’: Anal fin, with the first distinct melanophore stripe. I,I’: The pelvic fin (arrow) now has several distinct rays as well as a few melanophores amongst them.
Fig. 52
Fig. 52
Onset of anterior squamation; SA, 10.4 mm SL. A,A’: Whole body. Scale, 2 mm. B,B’: Head. C: Dorsal flank with ridges of scales (arrowheads) and early organization of scale melanophores. D: Posterior tail with scale ridges (arrowheads). E,E’: Middle trunk showing dorsal and anal fins and pigment pattern. F,F’: Dorsal fin. G,G’: Caudal fin. H,H’: Anal fin. I,I’: The pelvic fin and residual fin fold at vent (arrow).
Fig. 53
Fig. 53
Juvenile; J, 11.0 mm SL. A,A’: Whole body, showing newly completed squamation and scale melanophore pattern. Scale, 2 mm. B,B’: Head. C: Dorsum immediately posterior to head. D: Dorsal–anterior flank. E,E’: Middle trunk showing juvenile pigment pattern on body as well as dorsal and anal fins; a few residual embryonic/early larval melanophores still can be found in the interstripe at this stage. F,F’: Dorsal fin. G,G’: Caudal fin. H,H’: Anal fin. I,I’: Pelvic fin and vent, without residual fin fold.
Fig. 54
Fig. 54
Following juvenile; J+, 13.0 mm SL. A,A’: Whole body. Scale, 2 mm. B,B’: Head. C: Dorsum anterior to dorsal fin, showing additional melanophores that have appeared on scales. D: Posterior tail. E,E’: Middle trunk showing completed juvenile pigment pattern on body as well as dorsal and anal fins. F,F’: Dorsal fin. G,G’: Caudal fin. H,H’: Anal fin. I,I’: Pelvic fin and vent, without residual fin fold.
Fig. 55
Fig. 55
Following juvenile; J++, 16 mm SL. A: Whole body. Scale, 3 mm. B: Head. C: Dorsal flank anterior to dorsal fin, showing emergence of secondary dorsal melanophore stripe (2D). D: Middle trunk. E,E’: Caudal fin.
Fig. 56
Fig. 56
Adult female; A(f), 23 mm SL. A: Whole body. This female is gravid as evidenced by distended abdomen. Scale, 4 mm. B: Head. C: Dorsal flank anterior to dorsal fin. D: Middle trunk. E,E’: Caudal fin. F,F’: Pelvic fin and vent, showing protrusion of cloaca from body wall typical of gravid females.
Fig. 57
Fig. 57
Adult female; A(f), 26 mm SL. A: Whole body. Scale, 4 mm. B: Head. C: Dorsal flank anterior to dorsal fin. D: Middle trunk. E,E’: Caudal fin. F,F’: Pelvic fin and vent; cloaca is flush with body wall, typical of males.

References

    1. Balon EK. Alternative ways to become a juvenile or a definitive phenotype (and on some persisting linguistic offenses) Environmental Biology Of Fishes. 1999;56:17–38.
    1. Bird NC, Mabee PM. Developmental morphology of the axial skeleton of the zebrafish, Danio rerio (Ostariophysi: Cyprinidae) Dev Dyn. 2003;228:337–357. - PubMed
    1. Brown DD, Cai L. Amphibian metamorphosis. Dev Biol. 2007;306:20–33. - PMC - PubMed
    1. Brown ME. Experimental studies on growth. In: Brown ME, editor. The Physiology of Fishes. Academic Press; New York: 1957. pp. 361–400.
    1. Campinho MA, Moutou KA, Power DM. Temperature sensitivity of skeletal ontogeny in Oreochromis mossambicus. Journal of Fish Biology. 2004;65:1003–1025.

Publication types