. 2010 Jan 15;285(3):2051-63.
doi: 10.1074/jbc.M109.072587. Epub 2009 Nov 5.

Mutational mapping and modeling of the binding site for (S)-citalopram in the human serotonin transporter

Affiliations

Mutational mapping and modeling of the binding site for (S)-citalopram in the human serotonin transporter

Jacob Andersen et al. J Biol Chem. .

Abstract

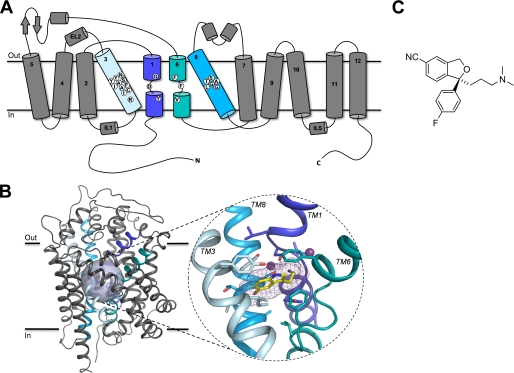
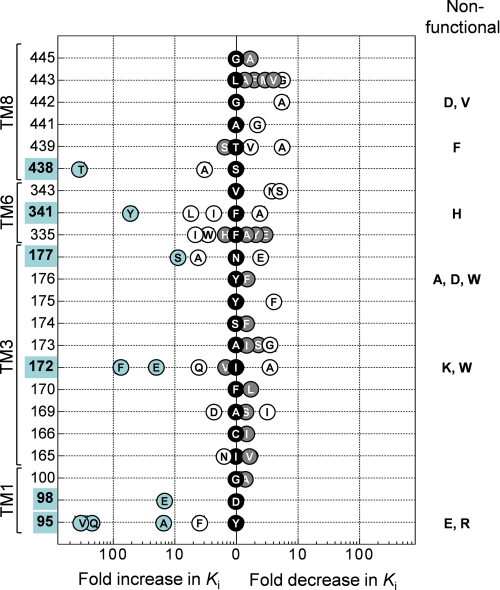
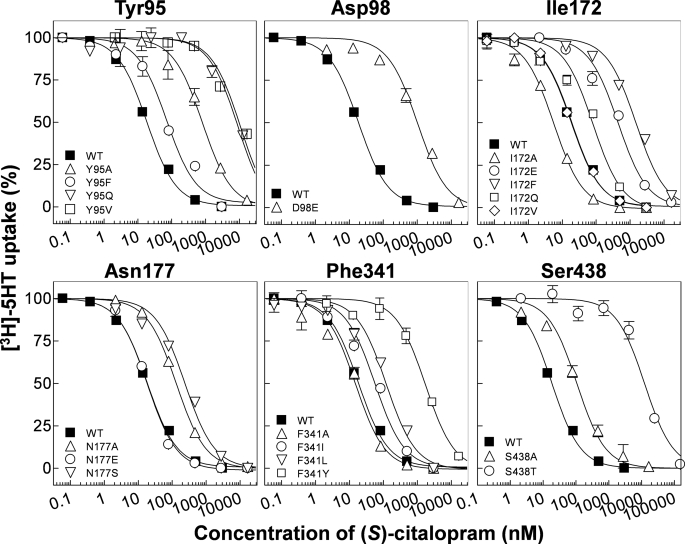
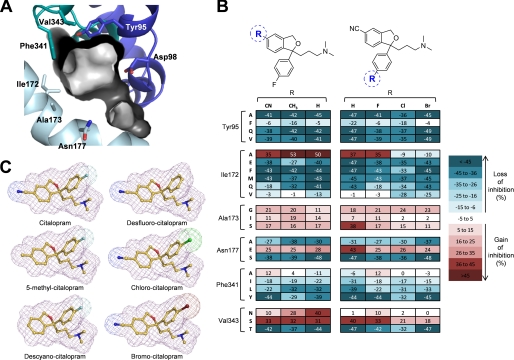
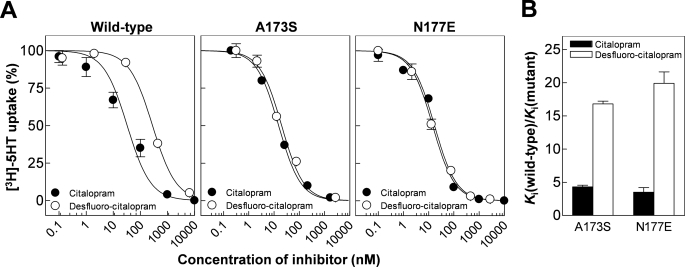
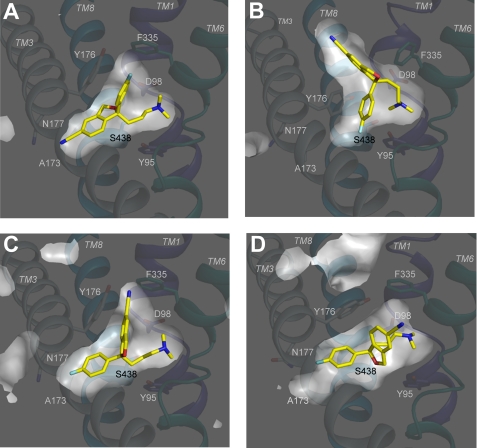
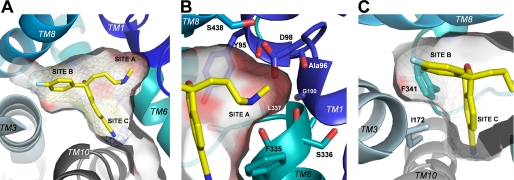
The serotonin transporter (SERT) regulates extracellular levels of the neurotransmitter serotonin (5-hydroxytryptamine) in the brain by facilitating uptake of released 5-hydroxytryptamine into neuronal cells. SERT is the target for widely used antidepressant drugs, including imipramine, fluoxetine, and (S)-citalopram, which are competitive inhibitors of the transport function. Knowledge of the molecular details of the antidepressant binding sites in SERT has been limited due to lack of structural data on SERT. Here, we present a characterization of the (S)-citalopram binding pocket in human SERT (hSERT) using mutational and computational approaches. Comparative modeling and ligand docking reveal that (S)-citalopram fits into the hSERT substrate binding pocket, where (S)-citalopram can adopt a number of different binding orientations. We find, however, that only one of these binding modes is functionally relevant from studying the effects of 64 point mutations around the putative substrate binding site. The mutational mapping also identify novel hSERT residues that are crucial for (S)-citalopram binding. The model defines the molecular determinants for (S)-citalopram binding to hSERT and demonstrates that the antidepressant binding site overlaps with the substrate binding site.


Figures

FIGURE 1.
FIGURE 1.
A, schematic representation of the topology of hSERT. The putative substrate binding site is formed by residues located in TM1 (dark blue), TM3 (light blue), TM6 (aqua), and TM8 (cyan). White circles indicate the amino acid positions selected for mutagenesis. In B: Left, main-chain trace representation of a structural model of hSERT in complex with the substrate 5HT (17) with α-helices shown as helical ribbons. TMs 1, 3, 6, and 8 are highlighted using color coding as in A. The semi-transparent sphere outlines the location of the putative substrate binding site. Right, close-up view of the putative 5HT binding site in hSERT. Only TMs 1, 3, 6, and 8 forming the binding site are shown, whereas the remaining TMs have been omitted for clarity. 5HT and residues surrounding the substrate binding site are shown as stick representations, and the two sodium ions are shown as purple spheres. Carbons are colored according to the color code of the parent TM segment except for 5HT, which is yellow. Nitrogens and oxygens are dark blue and red, respectively. C, structure of (S)-citalopram.
FIGURE 2.
FIGURE 2.
Effect on (S)-citalopram potency of mutations in the substrate binding pocket. Graphic summary of the fold change in Ki (shown on the x-axis) for (S)-citalopram induced by introduction of different point mutations at various positions (shown on the y-axis) in hSERT. The -fold change is calculated as Ki(wild-type)/Ki(mutant) or Ki(mutant)/Ki(wild-type) for mutations decreasing or increasing (S)-citalopram potency, respectively. Black data points located at the x = 0 position indicate the identity of the wild-type residue (one-letter amino acid coding). Gray shading of data points specifies that the mutation did not significantly affect Ki compared with wild type, whereas open circles specify a significant change (p < 0.05; repeated measures analysis of variance followed by Dunnett's post hoc test). Mutations producing >10-fold change in Ki and their corresponding positions are highlighted in blue. Error bars are ±S.E. and shown when larger than symbols. Ki values and statistics are shown in Table 1. Non-functional mutants are indicated on the right.
FIGURE 3.
FIGURE 3.
Analysis of (S)-citalopram potency at wild-type and mutant hSERT. Dose-response curves from representative experiments of inhibition by (S)-citalopram of [3H]5HT uptake in COS7 cells transfected with hSERT cDNA carrying point mutations at the critical amino acid positions Tyr-95, Asp-98, Ile-172, Asn-177, Phe-341, and Ser-438 as described under “Experimental Procedures.” Data points represent the mean from triplicate determinations of accumulated radioactivity in cells incubated with [3H]5HT in the presence of increasing concentrations of inhibitor. Uptake has been normalized to percent uptake of cells incubated in absence of inhibitor. Error bars are ±S.E. and shown when larger than symbols. The normalized data were plotted versus log of the molar concentration of competitor and fit to a nonlinear one-site competition curve as described under “Experimental Procedures.”
FIGURE 4.
FIGURE 4.
Effect of mutations on inhibition of hSERT by analogs of citalopram. A, view of the substrate binding pocket with the pocket surface shown as contour. Key residues Tyr-95, Asp-98, Ile-172, Ala-173, Asn-177, Phe-341, and Val-343 are shown as stick representations color coded as in Fig. 1. B, three-dimensional stick presentations of the structures of citalopram and analogs with molecule contours shown as mesh. Carbons are in yellow, nitrogens in dark blue, oxygens in red, fluorine in light blue, chlorine in green, and bromine in dark red. C, heat map representation of mutation-induced change in uptake inhibition by citalopram analogs carrying modifications around the cyanophtalane moiety (left) or fluorophenyl moiety (right). Values represent differences between the percent inhibition produced by a single inhibitor concentration of [3H]5HT uptake in COS7 cells expressing wild-type or mutant hSERT. For each analog, the test concentration was chosen to be the IC50 concentration for wild-type hSERT (in nm): citalopram, 59; chlorocitalopram, 49; bromocitalopram, 121; desfluoro-citalopram, 232; descyanocitalopram, 154; and 5-methylcitalopram, 70 (see supplemental Fig. S1). Data represent the mean difference from at least three independent experiments, where inhibition at wild-type and mutant hSERT was determined in triplicate.
FIGURE 5.
FIGURE 5.
Effect of A173S and N177E on citalopram and des-fluorocitalopram potency. A, representative dose-response curves for inhibition by citalopram (•) and desfluorocitalopram (○) of wild type (left), A173S (middle), and N177E (right). Data points represent the mean from triplicate determinations. Error bars are ±S.E. and shown when larger than symbols. B, graphic summary of mutational effect on citalopram and desfluorocitalopram on inhibitory potency. Error bars are ±S.E. from at least three different experiments.
FIGURE 6.
FIGURE 6.
Orientation of (S)-citalopram in different models obtained from docking of the inhibitor into the substrate binding pocket of hSERT. A–D, models were generated by docking of (S)-citalopram into homology models of hSERT generated on the basis of two conformational different crystal structures of the bacterial leucine transporter LeuT as described under “Experimental Procedures.” Shown are cross-sectional illustrations of Models A–D. TMs 1, 3, 6, and 8 are shown as main-chain trace representation using the same coloring scheme as in Fig. 1, whereas the rest of the protein is omitted for clarity. (S)-Citalopram and key residues are shown as stick representations with the coloring scheme as in Fig. 1. A, IFD of (S)-citalopram into the occluded hSERT homology model (Model A). B, IFD of (S)-citalopram into the outward-facing hSERT homology model (Model B). C, glide docking of (S)-citalopram into the occluded hSERT homology model (Model C). D, IFD of (S)-citalopram into the occluded hSERT homology model (Model D).
FIGURE 7.
FIGURE 7.
(S)-Citalopram binding in the hSERT substrate binding pocket (Model D). A, the (S)-citalopram binding pocket viewed from the extracellular side with the pocket surface shown as transparent contour. The three functional groups on the ligand occupy three distinct sub-pockets within the pocket: the dimethylaminopropyl chain in site A, the fluorophenyl group in site B, and the cyanophtalane group in site C. (S)-Citalopram is displayed as sticks in yellow. B, close-up view of the dimethylaminopropyl chain in site A. Protein side chains and backbone groups forming possible direct contacts to the aminopropyl moiety are shown as stick representations. Carbons are shaded according to the color code of the parent TM segment (same coloring scheme as in Fig. 1). The surface pocket contour is shaded according to electronegativity with increasing intensity of red signifying increasing electronegativity. C, a hydrophobic bulge between site B and site C is formed by the side chains of Ile-172 and Phe-341.

References

    1. Masson J., Sagné C., Hamon M., El Mestikawy S. (1999) Pharmacol. Rev. 51, 439–464 - PubMed
    1. Gether U., Andersen P. H., Larsson O. M., Schousboe A. (2006) Trends Pharmacol. Sci. 27, 375–383 - PubMed
    1. Rudnick G. (2006) J. Membr. Biol. 213, 101–110 - PubMed
    1. Chen N. H., Reith M. E., Quick M. W. (2004) Pflugers Arch. 447, 519–531 - PubMed
    1. Moltzen E. K., Bang-Andersen B. (2006) Curr. Top. Med. Chem. 6, 1801–1823 - PubMed

Publication types

MeSH terms

LinkOut - more resources