

GATE: software for the analysis and visualization of high-dimensional time series expression data
- PMID: 19892805
- PMCID: PMC2796822
- DOI: 10.1093/bioinformatics/btp628
GATE: software for the analysis and visualization of high-dimensional time series expression data
Abstract
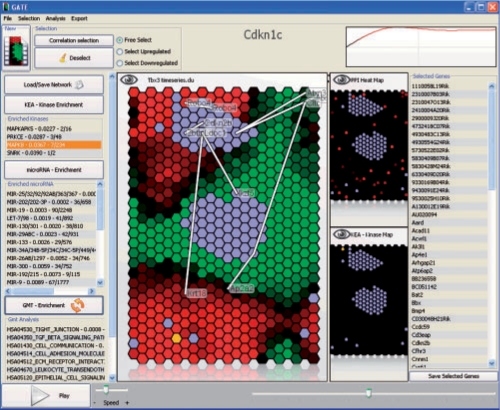
Summary: We present Grid Analysis of Time series Expression (GATE), an integrated computational software platform for the analysis and visualization of high-dimensional biomolecular time series. GATE uses a correlation-based clustering algorithm to arrange molecular time series on a two-dimensional hexagonal array and dynamically colors individual hexagons according to the expression level of the molecular component to which they are assigned, to create animated movies of systems-level molecular regulatory dynamics. In order to infer potential regulatory control mechanisms from patterns of correlation, GATE also allows interactive interroga-tion of movies against a wide variety of prior knowledge datasets. GATE movies can be paused and are interactive, allowing users to reconstruct networks and perform functional enrichment analyses. Movies created with GATE can be saved in Flash format and can be inserted directly into PDF manuscript files as interactive figures.
Availability: GATE is available for download and is free for academic use from http://amp.pharm.mssm.edu/maayan-lab/gate.htm
Figures
References
-
- Eichler GS, et al. Gene Expression Dynamics Inspector (GEDI): for integrative analysis of expression profiles. Bioinformatics. 2003;19:2321–2322. - PubMed
Publication types
MeSH terms
Substances
Grants and funding
LinkOut - more resources
Full Text Sources
Molecular Biology Databases
Miscellaneous
