

MEROPS: the peptidase database
- PMID: 19892822
- PMCID: PMC2808883
- DOI: 10.1093/nar/gkp971
MEROPS: the peptidase database
Abstract
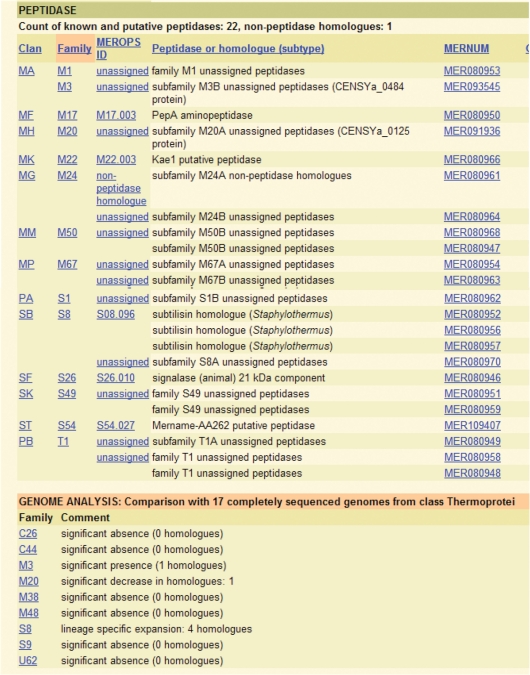
Peptidases, their substrates and inhibitors are of great relevance to biology, medicine and biotechnology. The MEROPS database (http://merops.sanger.ac.uk) aims to fulfil the need for an integrated source of information about these. The database has a hierarchical classification in which homologous sets of peptidases and protein inhibitors are grouped into protein species, which are grouped into families, which are in turn grouped into clans. The classification framework is used for attaching information at each level. An important focus of the database has become distinguishing one peptidase from another through identifying the specificity of the peptidase in terms of where it will cleave substrates and with which inhibitors it will interact. We have collected over 39,000 known cleavage sites in proteins, peptides and synthetic substrates. These allow us to display peptidase specificity and alignments of protein substrates to give an indication of how well a cleavage site is conserved, and thus its probable physiological relevance. While the number of new peptidase families and clans has only grown slowly the number of complete genomes has greatly increased. This has allowed us to add an analysis tool to the relevant species pages to show significant gains and losses of peptidase genes relative to related species.
Figures
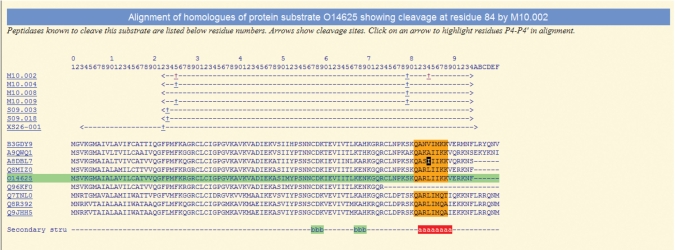
 ) shows where cleavage occurs. Each symbol can be clicked, and the alignment will be highlighted to show conservation around that cleavage site. Four residues either side of each cleavage site (P4–P4′) (6) are highlighted. Completely conserved residues are highlighted in orange. Although not shown in this example, a residue highlighted in pink would not be conserved, but the amino acid would have been observed in the same position in another MMP8 substrate. Ile84 in the sequence from the European ferret (Mustela putorius fero), labelled UniProt A8DBL7, is shown with a black background because isoleucine is unknown in this position for any MMP8 substrate. The last line shows the secondary structure: an alpha helix is shown as a series of ‘a’s highlighted in red, and a strand as a series of ‘b’s highlighted in green. This example shows that MMP8 is capable of cleaving this protein substrate within an alpha helix.
References
-
- Barrett AJ, Rawlings ND. Species of peptidases. Biol. Chem. 2007;388:1151–1157. - PubMed
-
- Rawlings ND, Morton FR. The MEROPS batch BLAST: a tool to detect peptidases and their non-peptidase homologues in a genome. Biochimie. 2008;90:243–259. - PubMed
-
- Barrett AJ, Rawlings ND, Woessner JF, editors. Handbook of Proteolytic Enzymes. London: Academic Press; 1998.
Publication types
MeSH terms
Substances
Grants and funding
LinkOut - more resources
Full Text Sources
Other Literature Sources
