Activation of the Wnt pathway plays a pathogenic role in diabetic retinopathy in humans and animal models
- PMID: 19893025
- PMCID: PMC2789621
- DOI: 10.2353/ajpath.2009.080945
Activation of the Wnt pathway plays a pathogenic role in diabetic retinopathy in humans and animal models
Abstract
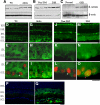
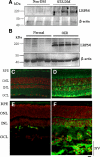
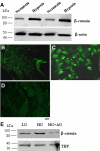
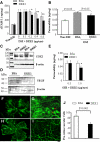
Although Wnt signaling is known to mediate multiple biological and pathological processes, its association with diabetic retinopathy (DR) has not been established. Here we show that retinal levels and nuclear translocation of beta-catenin, a key effector in the canonical Wnt pathway, were increased in humans with DR and in three DR models. Retinal levels of low-density lipoprotein receptor-related proteins 5 and 6, coreceptors of Wnts, were also elevated in the DR models. The high glucose-induced activation of beta-catenin was attenuated by aminoguanidine, suggesting that oxidative stress is a direct cause for the Wnt pathway activation in diabetes. Indeed, Dickkopf homolog 1, a specific inhibitor of the Wnt pathway, ameliorated retinal inflammation, vascular leakage, and retinal neovascularization in the DR models. Dickkopf homolog 1 also blocked the generation of reactive oxygen species induced by high glucose, suggesting that Wnt signaling contributes to the oxidative stress in diabetes. These observations indicate that the Wnt pathway plays a pathogenic role in DR and represents a novel therapeutic target.
Figures


Similar articles
-
Nitrosative stress plays an important role in Wnt pathway activation in diabetic retinopathy.Antioxid Redox Signal. 2013 Apr 1;18(10):1141-53. doi: 10.1089/ars.2012.4583. Epub 2012 Oct 15. Antioxid Redox Signal. 2013. PMID: 23066786 Free PMC article.
-
The pathogenic role of the canonical Wnt pathway in age-related macular degeneration.Invest Ophthalmol Vis Sci. 2010 Sep;51(9):4371-9. doi: 10.1167/iovs.09-4278. Epub 2009 Oct 29. Invest Ophthalmol Vis Sci. 2010. PMID: 19875668 Free PMC article.
-
Inhibition of connective tissue growth factor overexpression in diabetic retinopathy by SERPINA3K via blocking the WNT/beta-catenin pathway.Diabetes. 2010 Jul;59(7):1809-16. doi: 10.2337/db09-1056. Epub 2010 Mar 18. Diabetes. 2010. PMID: 20299474 Free PMC article.
-
Canonical Wnt signaling in diabetic retinopathy.Vision Res. 2017 Oct;139:47-58. doi: 10.1016/j.visres.2017.02.007. Epub 2017 Jun 2. Vision Res. 2017. PMID: 28545982 Free PMC article. Review.
-
Mechanisms involved in the development of diabetic retinopathy induced by oxidative stress.Redox Rep. 2017 Jan;22(1):10-16. doi: 10.1080/13510002.2016.1205303. Epub 2016 Jul 15. Redox Rep. 2017. PMID: 27420399 Free PMC article. Review.
Cited by
-
Pathogenic role of the Wnt signaling pathway activation in laser-induced choroidal neovascularization.Invest Ophthalmol Vis Sci. 2013 Jan 7;54(1):141-54. doi: 10.1167/iovs.12-10281. Invest Ophthalmol Vis Sci. 2013. PMID: 23211829 Free PMC article.
-
Bach1 Represses Wnt/β-Catenin Signaling and Angiogenesis.Circ Res. 2015 Jul 31;117(4):364-375. doi: 10.1161/CIRCRESAHA.115.306829. Epub 2015 Jun 29. Circ Res. 2015. PMID: 26123998 Free PMC article.
-
Blockade of VEGF-induced GSK/β-catenin signaling, uPAR expression and increased permeability by dominant negative p38α.Exp Eye Res. 2012 Jul;100:101-8. doi: 10.1016/j.exer.2012.03.011. Epub 2012 Apr 30. Exp Eye Res. 2012. PMID: 22564969 Free PMC article.
-
Sustained therapeutic effect of an anti-inflammatory peptide encapsulated in nanoparticles on ocular vascular leakage in diabetic retinopathy.Front Cell Dev Biol. 2022 Dec 16;10:1049678. doi: 10.3389/fcell.2022.1049678. eCollection 2022. Front Cell Dev Biol. 2022. PMID: 36589744 Free PMC article.
-
A Protective Effect of PPARα in Endothelial Progenitor Cells Through Regulating Metabolism.Diabetes. 2019 Nov;68(11):2131-2142. doi: 10.2337/db18-1278. Epub 2019 Aug 26. Diabetes. 2019. PMID: 31451517 Free PMC article.
References
-
- Wild S, Roglic G, Green A, Sicree R, King H. Global prevalence of diabetes: estimates for the year 2000 and projections for 2030. Diabetes Care. 2004;27:1047–1053. - PubMed
-
- Joussen AM, Poulaki V, Le ML, Koizumi K, Esser C, Janicki H, Schraermeyer U, Kociok N, Fauser S, Kirchhof B, Kern TS, Adamis AP. A central role for inflammation in the pathogenesis of diabetic retinopathy. FASEB J. 2004;18:1450–1452. - PubMed
-
- Funatsu H, Noma H, Mimura T, Eguchi S, Hori S. Association of vitreous inflammatory factors with diabetic macular edema. Ophthalmology. 2009;116:73–79. - PubMed
-
- Limb GA, Hickman-Casey J, Hollifield RD, Chignell AH. Vascular adhesion molecules in vitreous from eyes with proliferative diabetic retinopathy. Invest Ophthalmol Vis Sci. 1999;40:2453–2457. - PubMed
-
- Khalfaoui T, Lizard G, Ouertani-Meddeb A. Adhesion molecules (ICAM-1 and VCAM-1) and diabetic retinopathy in type 2 diabetes. J Mol Histol. 2008;39:243–249. - PubMed
Publication types
MeSH terms
Substances
Grants and funding
LinkOut - more resources
Full Text Sources
Other Literature Sources
Medical

