. 2009 Dec;175(6):2528-39.
doi: 10.2353/ajpath.2009.090147. Epub 2009 Nov 5.

Signal regulatory protein-beta1: a microglial modulator of phagocytosis in Alzheimer's disease

Affiliations

Signal regulatory protein-beta1: a microglial modulator of phagocytosis in Alzheimer's disease

Sadanand Gaikwad et al. Am J Pathol. 2009 Dec.

Abstract

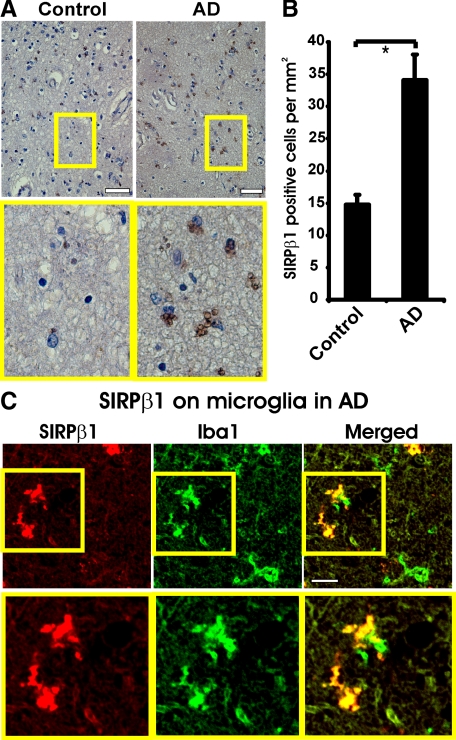
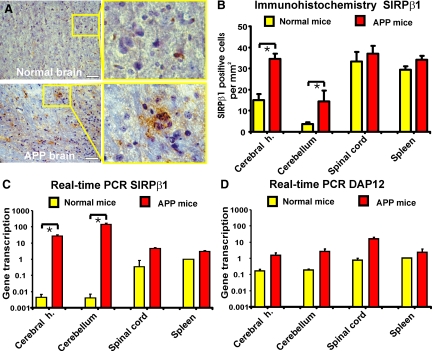
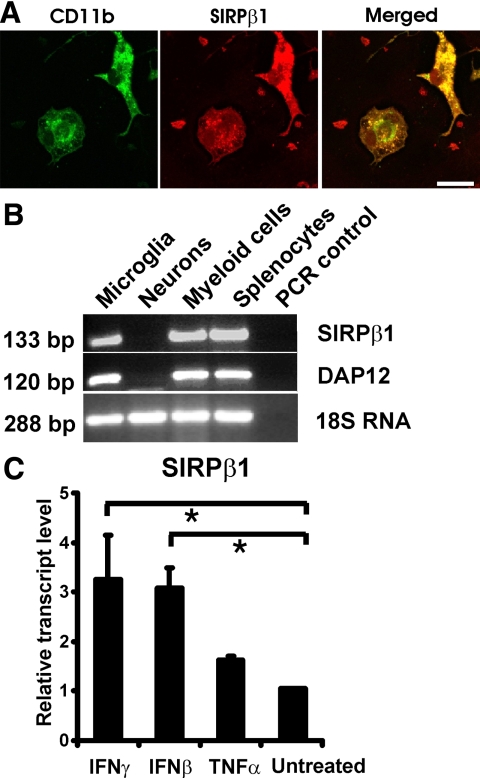
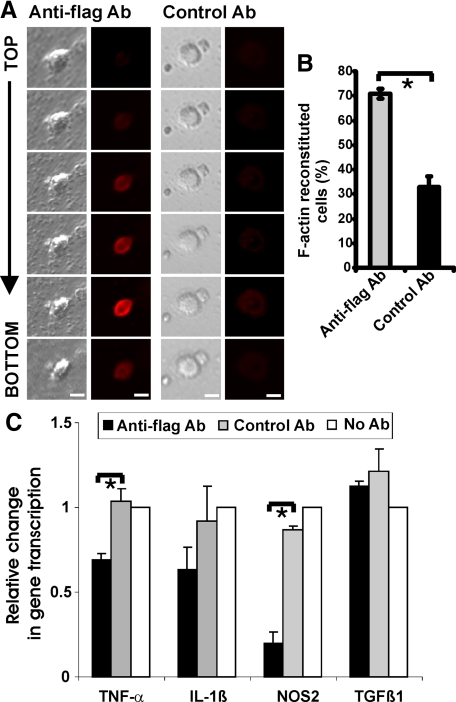
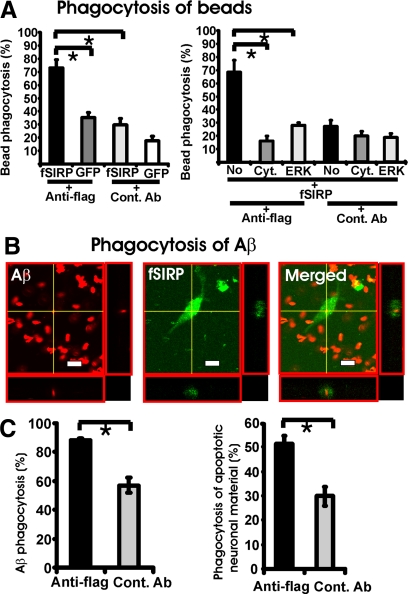
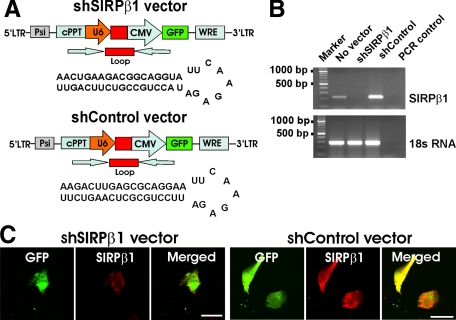
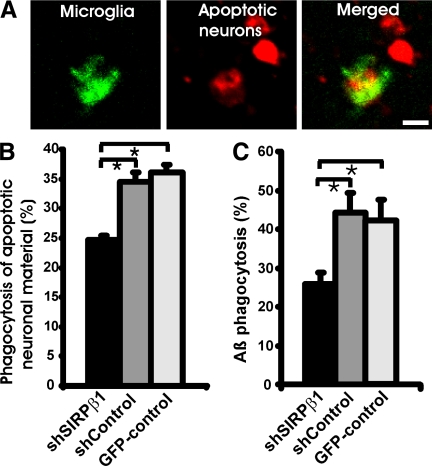
The signal regulatory protein-beta1 (SIRPbeta1) is a DAP12-associated transmembrane receptor expressed in a subset of hematopoietic cells. Recently, it was shown that peritoneal macrophages express SIRPbeta1, which positively regulated phagocytosis. Here, we found that SIRPbeta1 was up-regulated and acted as a phagocytic receptor on microglia in amyloid precursor protein J20 (APP/J20) transgenic mice and in Alzheimer's disease (AD) patients. Interferon (IFN)-gamma and IFN-beta stimulated gene transcription of SIRPbeta1 in cultured microglia. Activation of SIRPbeta1 on cultured microglia by cross-linking antibodies induced reorganization of the cytoskeleton protein beta-actin and suppressed lipopolysaccharide-induced gene transcription of tumor necrosis factor-alpha and nitric oxide synthase-2. Furthermore, activation of SIRPbeta1 increased phagocytosis of microsphere beads, neural debris, and fibrillary amyloid-beta (Abeta). Phagocytosis of neural cell debris and Abeta was impaired after lentiviral knockdown of SIRPbeta1 in primary microglial cells. Thus, SIRPbeta1 is a novel IFN-induced microglial receptor that supports clearance of neural debris and Abeta aggregates by stimulating phagocytosis.


Figures

Figure 1
Figure 1
Detection of SIRPβ1 in Alzheimer’s disease brain tissue. A: Immunocytochemistry with antibodies directed against SIRPβ1 of the superior temporal neocortex from a control case (control) and an Alzheimer’s disease patient (AD). Light microscopy showed expression of SIRPβ1 in cells with microglial morphology. Scale bar: 100 μm. Inset of higher magnification as indicated. B: Quantification of SIRPβ1-positive cells in AD versus control brain tissue samples. Data demonstrated an increased number of SIRPβ1-positive cells in the superior temporal neocortex of AD patients compared with control cases. Mean ± SEM of n = 6 patients/cases per group. P < 0.05, unpaired t-test. C: Brain tissue sections of AD patients were double-immunolabeled with antibodies directed against SIRPβ1 and the microglial marker protein Iba1. A subset of microglial cells identified by double-labeling with Iba1 expressed SIRPβ1. Inset of higher magnification as indicated. Scale bar: 30 μm.
Figure 2
Figure 2
Increased protein expression and gene transcription of SIRPβ1 in the cerebrum and cerebellum of APP transgenic mice. A: Immunohistochemistry with antibody directed against SIRPβ1 was performed on tissue sections of normal and APP/J20 transgenic mice at 12 months of age. Expression of SIRPβ1 was detected in a few cells with microglial morphology in the cerebral hemispheres of normal adult mice. An increased number of SIRPβ1-positive cells with microglial morphology was observed in the cerebral hemispheres of aged APP/J20 transgenic mice (APP brain). Inset of higher magnification as indicated. Scale bars: 100 μm. B: Quantification of SIRPβ1 immunostained cells in the spinal cord, cerebellum, cerebral hemisphere (cerebral h.) and spleen tissues derived from APP/J20 transgenic and normal mice at 12 months of age. The number of cells immunolabeled for SIRPβ1 was increased in the cerebral hemisphere (cerebral h.) and cerebellum of APP/J20 transgenic mice compared with normal adult mice. Data are shown as mean ± SEM of n = 3 independent experiments. P < 0.05, analysis of variance followed by Bonferroni’s multiple comparison test. C: Relative gene transcript levels of SIRPβ1 in the spinal cord, cerebellum, cerebral hemisphere (cerebral h.), and spleen tissues derived from APP/J20 transgenic and normal mice at 12 months of age. Gene transcript level of SIRPβ1 was increased in the cerebral hemisphere and cerebellum of APP/J20 transgenic mice compared with normal control mice. Data are shown as mean ± SEM of n = 6 independent experiments. P < 0.05, analysis of variance followed by Bonferroni’s multiple comparison test. D: Relative gene transcript levels of the adaptor protein DAP12 in the spinal cord, cerebellum, cerebral hemisphere (cerebral h.), and spleen tissues derived from APP/J20 transgenic and normal mice at 12 months of age. Gene transcript levels of DAP12 were only slightly increased in all tissues analyzed in APP/J20 transgenic mice compared with normal control mice. Data are shown as mean ± SEM of n = 6 independent experiments. P < 0.05, analysis of variance followed by Bonferroni’s multiple comparison test.
Figure 3
Figure 3
Protein expression and gene transcription of SIRPβ1 in cultured primary microglia. A: SIRPβ1 protein was detected in cultured primary microglia by immunofluorescence labeling with a rat monoclonal antibody directed against mouse SIRPβ1. Microglial cells were identified by double-labeling with antibodies directed against CD11b. Scale bar: 15 μm. B: RT-PCR analysis for SIRPβ1 and DAP12 gene transcripts of cultured microglia, neurons, bone marrow-derived myeloid precursor cells (myeloid cells), and splenocytes. Gene transcripts for SIRPβ1 and DAP12 were detected in microglia, bone marrow-derived myeloid cells and splenocytes but not in neurons. Amplification of 18S RNA was used as an internal control. PCR without reverse transcriptase was used as negative control (PCR control). C: Real-time RT-PCR analysis of cultured primary microglia for SIRPβ1. Cells were treated for 48 hours with IFN-γ (murine IFN-γ; 100 U/ml), IFN-β (murine IFN-β; 103 U/ml), or TNF-α (murine TNF-α; 10 ng/ml). Treatment with either IFN-γ or IFN-β up-regulated gene transcription of SIRPβ1. Data are normalized to untreated control and presented as mean ± SEM of n = 3 independent experiments. P < 0.05, analysis of variance followed by Bonferroni’s multiple comparison test.
Figure 4
Figure 4
SIRPβ1 cross-linking on microglia induced F-actin reorganization and reduced gene transcription of proinflammatory mediators. A: Phase contrast and confocal images (z-stacks from top to bottom) of flag-tagged SIRPβ1-transduced primary microglia cultured for 1 hour on dishes coated with flag-specific antibody (anti-flag Ab) or isotype control antibody (control Ab). Detection of F-actin was performed by labeling with fluorescence dye-conjugated phalloidin. Reorganization of the actin cytoskeleton (F-actin labeling) was observed in flag-tagged SIRPβ1-stimulated cells at the bottom of the cells at the region of antibody binding. Scale bar: 10 μm. B: Percentage of F-actin-labeled microglial cells transduced with flag-tagged SIRPβ1 was quantified after stimulation with flag-specific antibody (anti-flag AB) or control antibody (control Ab). Cross-linking of SIRPβ1 increased the number of microglial cells showing F-actin staining at the bottom of the cells. Data are presented as mean ± SEM of n = 3 independent experiments. P < 0.05, unpaired t-test. C: Primary microglial cells were transduced with flag-tagged SIRPβ1 and treated with lipopolysaccharide for 24 hours to induce gene transcription of proinflammatory mediators. Microglial cells were cultured on dishes coated with cross-linking antibody directed against the flag epitope (anti-flag Ab). An irrelevant antibody of the same isotype (control Ab) and no antibody were used as controls. Cross-linking of SIRPβ1 reduced lipopolysaccharide-induced gene transcription of TNF-α and NOS2. Data are presented as mean ± SEM of n = 3 independent experiments. P < 0.05, analysis of variance, followed by Bonferroni’s multiple comparison test.
Figure 5
Figure 5
Increased microglial phagocytosis after stimulation of SIRPβ1. A: Increased phagocytosis of microsphere beads after stimulation of flag-tagged SIRPβ1 (fSIRPβ1). Primary microglial cells were lentivirally transduced with the flag-tagged SIRPβ1 (fSIRP) or the control GFP vector (GFP) and were cultured for 24 hours on dishes coated with flag-specific antibody (anti-flag) or control antibody (cont. Ab). The percentage of microglia having phagocytosed beads was quantified by flow cytometry. Stimulation of fSIRPβ1 on transduced primary microglia by the flag-specific antibody (anti-flag) increased the percentage of microglia having taken up microsphere beads compared with GFP-transduced microglia (GFP) and the isotype control antibody (Cont. Ab). Treatment of microglia with the actin polymerization inhibitor cytochalasin D (Cyt.) or the mitogen-activated protein kinase inhibitor PD98059 (ERK) prevented the increased phagocytosis induced by stimulation of fSIRPβ1 (no: no treatment). Data are presented as mean ± SEM of n = 3 independent experiments. P < 0.05 analysis of variance, followed by Bonferroni’s multiple comparison test. B: Phagocytosis of Aβ42 after stimulation of fSIRPβ1. Primary microglial cells were transduced with the fSIRPβ1 vector. Cells were cultured on dishes coated with flag-specific antibody and then Aβ42 was added for 6 hours before fixation. Phagocytosis of Aβ42 was analyzed by confocal microscopy. Serial sections along the z-axis were acquired and composed to images. Aβ42 was localized within the microglial cell. Scale bar: 10 μm. C: Increased phagocytosis of Aβ42 and neural debris after fSIRPβ1 stimulation. Primary microglial cells were transduced with the fSIRPβ1 vector and were cultured for 24 hours on dishes coated with flag-specific antibody (anti-flag) or isotype control antibody (Cont. Ab). Biotinylated Aβ42 or apoptotic neuronal material was added. Percentage of primary microglia having phagocytosed Aβ42 or neuronal debris was quantified by confocal microscopy. Stimulation of fSIRPβ1 increased the uptake of Aβ42 and apoptotic neuronal material. Data are presented as mean ± SEM of n = 3 independent experiments. P < 0.05, analysis of variance.
Figure 6
Figure 6
Lentiviral knock-down of SIRPβ1. A: Schematic drawings of the lentiviral short hairpin RNA interference vector targeting mouse SIRPβ1 (shSIRPβ1) and the scrambled short hairpin RNA control (shControl) vector. B: RT-PCR of cultured primary microglia transduced with shSIRPβ1 or shControl vector. SIRPβ1 gene transcripts were knocked down after transduction with shSIRPβ1, while SIRPβ1 gene transcripts were detected by RT-PCR without any vector (no vector) or after transduction with the shControl vector (shControl). 18S RNA: control for RNA. PCR control: RT-PCR without reverse transcription as control. C: Cultured primary microglial cells were either transduced with the shSIRPβ1 or shControl vector and immunolabeled with rat monoclonal antibodies directed against SIRPβ1. No immunostaining of SIRPβ1 was detected after knockdown of SIRPβ1, while SIRPβ1 was detected on shControl vector-transduced microglia. Scale bar: 20 μm.
Figure 7
Figure 7
Reduced phagocytosis after lentiviral knockdown of SIRPβ1. A: Microglial cells were transduced with the shControl vector and co-cultured with apoptotic neural membranes labeled with a red fluorescent dye. Confocal images of the shControl vector-transduced microglia showed uptake of the red dye-labeled membranes into a GFP+ microglia. Scale bar: 10 μm. B: Quantification of microglial cells having phagocytosed apoptotic neuronal cell membranes within 24 hours. Microglial cells were lentivirally transduced with shSIRPβ1, shControl, or GFP vector. Number of microglial cells having phagocytosed apoptotic neuronal material was reduced after lentiviral knockdown of SIRPβ1. Data are presented as mean ± SEM of n = 3 independent experiments. P < 0.05, analysis of variance, followed by Bonferroni’s multiple comparison test. C: Quantification of Aβ42 phagocytosis by primary microglia lentivirally transduced with shSIRPβ1, shControl, or GFP-control vector. Phagocytosis of Aβ42 was reduced after knockdown of SIRPβ1. Data are presented as mean ± SEM of n = 3 independent experiments. P < 0.05, analysis of variance, followed by Bonferroni’s multiple comparison test.

References

    1. Hanisch UK, Kettenmann H. Microglia: active sensor and versatile effector cells in the normal and pathologic brain. Nat Neurosci. 2007;10:1387–1394. - PubMed
    1. Carson MJ. Microglia as liaisons between the immune and central nervous systems: functional implications for multiple sclerosis. Glia. 2002;40:218–231. - PMC - PubMed
    1. Biber K, Neumann H, Inoue K, Boddeke HW. Neuronal “on” and “off” signals control microglia. Trends Neurosci. 2007;30:596–602. - PubMed
    1. Mrak RE, Griffin WS. Glia and their cytokines in progression of neurodegeneration. Neurobiol Aging. 2005;26:349–354. - PubMed
    1. Streit JM. Kettenmann H, Ransome B R, editors. Oxford, UK: Oxford University Press,; Microglial cells in Neuroglia second edition, 2005:pp 60–71.

Publication types