. 2009 Dec;175(6):2473-88.
doi: 10.2353/ajpath.2009.090166. Epub 2009 Nov 5.

Pseudomonas aeruginosa exotoxin pyocyanin causes cystic fibrosis airway pathogenesis

Affiliations

Pseudomonas aeruginosa exotoxin pyocyanin causes cystic fibrosis airway pathogenesis

Charles C Caldwell et al. Am J Pathol. 2009 Dec.

Abstract

The cystic fibrosis (CF) airway bacterial pathogen Pseudomonas aeruginosa secretes multiple virulence factors. Among these, the redox active exotoxin pyocyanin (PCN) is produced in concentrations up to 100 mumol/L during infection of CF and other bronchiectatic airways. However, the contributions of PCN during infection of bronchiectatic airways are not appreciated. In this study, we demonstrate that PCN is critical for chronic infection in mouse airways and orchestrates adaptive immune responses that mediate lung damage. Wild-type FVBN mice chronically exposed to PCN developed goblet cell hyperplasia and metaplasia, airway fibrosis, and alveolar airspace destruction. Furthermore, after 12 weeks of exposure to PCN, mouse lungs down-regulated the expression of T helper (Th) type 1 cytokines and polarized toward a Th2 response. Cellular analyses indicated that chronic exposure to PCN profoundly increased the lung population of recruited macrophages, CD4(+) T cells, and neutrophils responsible for the secretion of these cytokines. PCN-mediated goblet cell hyperplasia and metaplasia required Th2 cytokine signaling through the Stat6 pathway. In summary, this study establishes that PCN is an important P. aeruginosa virulence factor capable of directly inducing pulmonary pathophysiology in mice, consistent with changes observed in CF and other bronchiectasis lungs.


Figures
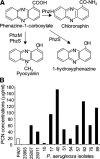
Figure 1
Figure 1
Biosynthesis and profiling of PCN in clinical isolates of P. aeruginosa from CF patients. A: PCN is synthesized from phenazine carboxylic acid via enzymatic modification by PhzM and PhzS. B: The majority of P. aeruginosa CF clinical isolates overproduced PCN.
Figure 2
Figure 2
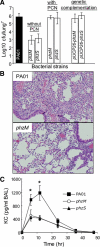
PCN-deficient mutants of P. aeruginosa are attenuated in causing chronic respiratory tract infections. A: Male FVBN mice (9 weeks old, groups of eight) were intratracheally infected with agarose-embedded wild-type P. aeruginosa strain PA01 or isogenic PCN-deficient mutants phzM or phzS or genetically complemented pucP26phzM or pucP26phzS. One group of mice infected with phzM or phzS was given exogenous PCN (50 μg) intranasally every day for 7 days. Attenuation is defined as the log10 difference in colony-forming units between PA01 and mutant bacteria recovered from lung tissue 7 days after inoculation. The mean ± SE was shown. P values: phzM (0.007) and phzS (0.009) against PA01. P values: phzM (0.687) and phzS (0.616) against PA01 when phzM and phzS mutants infected lungs were exogenously supplied with PCN. P values: pucP26phzM (0.481) and pucP26phzM (0.538) against PA01. B: H&E-stained lung sections of FVBN mice infected with wild-type PA01 and PCN-deficient mutant phzM. C: The profile of proinflammatory cytokine KC in PA01-infected versus phzM- or phzS-infected mice. *P < 0.001 when comparing PA01 against phzM or phzS.
Figure 3
Figure 3
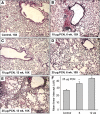
Chronic exposure of mouse lungs to PCN results in goblet cell hyperplasia. A: FVBN mice (groups of 12) were exposed to PCN (10 or 25 μg in 25 μl, three times per week, for 3, 6, and 12 weeks). Control mice were exposed to 25 μl of sterile H2O for the same duration. After BAL, the lungs were perfused with buffered formalin, embedded in parafin, sectioned, and double-stained with PAS. No mucin staining was detected in the conducting airways of control mice. B: After 12 weeks of exposure to 10 μg/ml PCN, small amounts of goblet cells were present as indicated by PAS-stained mucins (red arrows). C: After 6 weeks of exposure to 25 μg/ml PCN, goblet cells were present in conducting airways (red arrows). D: After 12 weeks of 25 μg/ml PCN instillation, mouse lungs developed goblet cell hyperplasia with numerous goblet cells stained positive for mucins (red arrows). E: Goblet cell metaplasia in a small airway. F: Airway MI of control and PCN-exposed mice. Lung sections from control and PCN-exposed mice were PAS stained. Airway MI was determined as described in Materials and Methods. Six weeks PCN (*P < 0.05) and 12 weeks PCN (*P < 0.05), respectively, when compared with control mice.
Figure 4
Figure 4
Chronic exposure to PCN causes fibrosis in conducting airways. A: Lung sections (as described in Figure 3) were stained for collagen with Masson’s trichrome. The presence of collagen is indicated by blue color in the lung sections. Lung sections from control mice indicate very low, basal levels of collagen. B and C: Lung sections from mice exposed to 10 μg/ml PCN for 6 and 12 weeks, showing basal levels of collagen. D: After 3 weeks of exposure to 25 μg/ml PCN, mouse lungs showed basal levels of collagen. E: After 6 weeks of exposure to 25 μg/ml PCN, increasing levels of collagens, particularly at the peribronchi and perivascular areas, are clearly visible in the lungs. F: After 12 weeks of exposure to 25 μg/ml PCN, fibrosis has spread into parenchyma of the lung immediately adjacent to bronchi and bronchioles. G: Masson’s trichrome staining of lung sections from a 12-week PCN-instilled (25 μg/ml) mouse that developed severe pulmonary fibrosis where consolidation has expanded to entire lobe of the lung. H: A fibrotic area from G magnified to ×40, indicating the blue-stained collagen (see white arrow). I: Chronic exposure to PCN results in overproduction of extracellular matrix within mouse lungs. The amounts of lung collagen were determined by hydroxyproline assays using whole lung homogenates from six FVBN mice chronically exposed to PCN. Data are the mean ± SE, n = 6. P values: 3 weeks PCN (0.95); 6 weeks PCN (0.0015); 12 weeks PCN (9.1 × 10⁻⁶). C = control mice.
Figure 5
Figure 5
Chronic exposure of mouse lungs to PCN causes alveolar airspace destruction. A: Lung sections from control or PCN-exposed mice (as described in Figure 3) were stained with H&E. Control mice with normal alveolar space. Magnification: ×10. B and C: After 6 or 12 weeks exposure to 10 μg/ml PCN, alveolar space destruction and enlargement was not statistically different from the control mice. Magnification: ×10. D: Alveolar space destruction and enlargement in mouse lungs following 6 weeks of exposure to 25 μg/ml PCN. Magnification: ×10. E: After 12 weeks of exposure to 25 μg/ml PCN, mouse lungs developed severe alveolar space destruction and enlargement. Magnification: ×10. F: MLI measurement of alveolar space destruction and enlargement. MLI was determined in mouse lungs exposed to 25 μg/ml PCN. MLI was calculated as described in Materials and Methods. Six weeks PCN (*P < 0.05) and 12 weeks PCN (*P < 0.001), respectively, when compared with control mice.
Figure 6
Figure 6
Chronic exposure to PCN alters the profiles of MIP-1α and Th1 cytokines IFN-γ and IL-12 p70 in the lungs. A: Cytokine concentrations were quantified by ELISA using BAL samples from control and PCN-exposed mice (25 μg/ml, Figure 3). The P values were derived by comparing cytokine levels in the BAL of PCN-exposed versus control mice. PCN increased the IFN-γ levels within BAL after 6 weeks exposure (*P < 0.05), but the cytokine levels returned to near normal after 12 weeks PCN exposure (*P < 0.05). B: PCN caused an early increase (3 weeks PCN, *P < 0.05) and then declining levels of IL-12 p70 (12 weeks PCN, **P < 0.001). C: PCN caused a transient increase in the levels of MIP-1α (6 weeks PCN, P < 0.01; 12 weeks PCN, P < 0.05).
Figure 7
Figure 7
Cytokine profiles demonstrate a Th2 polarization in mouse lung chronically exposed to PCN. After BAL, cell-free supernatants were collected from control and PCN-exposed mice (25 μg/ml; Figure 3). The amounts of cytokines were quantified by ELISA. PCN exposure decreased the levels of TGF-β (A) and IL-13 (B) in mouse lungs at initial stages of disease, but significantly increased the levels of TGF-β (A) and IL-13 (B) at more severe stages of PCN-induced lung pathogenesis. P values: TGF-β (3 weeks, P = 0.28; 6 weeks **P < 0.01; 12 weeks PCN; *P < 0.01). IL-13 (3 weeks, P = 0.11; 6 weeks, **P < 0.001; 12 weeks PCN; *P < 0.001). The P values were derived by comparing cytokine levels in the BAL of PCN-exposed versus control mice. C: PCN induced a continuous increase of IL-10 in mouse lungs (3 weeks PCN, *P < 0.01; 6 and 12 weeks PCN; **P < 0.001). D: PCN induced a significant increase of IL-4 in mouse lungs (3 weeks PCN, P = 0.73; 6 and 12 weeks PCN, *P < 0.001).
Figure 8
Figure 8
Enumeration of leukocyte subsets in mouse lungs chronically exposed to PCN. A: Cells were collected from BAL samples of control and PCN-treated mice (25 μg/ml; Figure 3), labeled with antibodies specific for the indicated cell types, and analyzed using flow cytometry. Chronic exposure to PCN increases the numbers of nonnaive CD4+ cells in mouse lungs (*P < 0.05 for 12 week PCN). B: Chronic exposure to PCN increases nonnaive CD8+ cells (P < 0.01 for 6 week PCN; *P < 0.001 for 12 week PCN). C: Chronic exposure to PCN decreases the number of resident macrophages (*P < 0.05 for 6 week PCN; **P < 0.01 for 12 week PCN). D: Chronic exposure to PCN increases the number of infiltrating macrophages (P < 0.05 for 12 week PCN). E: Chronic exposure to PCN increases the influx of neutrophils (*P < 0.05 for 6 and 12 week PCN). The P values were derived by comparing cells in the BAL of control and PCN-exposed mice.
Figure 9
Figure 9
Chronic exposure to PCN failed to induce goblet cell hyperplasia in the lungs of Stat6−/− mice. Wild-type C57BL/6 and Stat6−/− mice (groups of eight) were inoculated with 25 μg/ml PCN or sterile H2O (controls). A: No mucin is detected in the airways of control wild-type mice exposed to sterile H2O. B–D: After 3 weeks of exposure to 25 μg/ml PCN, wild-type mice developed goblet cell hyperplasia in large airways (B and C) and metaplasia in small airways (D), as indicated by PAS-stained mucins (arrows). E: No mucin staining was detected in the airways of Stat6−/− mice. F: Wild-type mice exposed to PCN have a significantly higher MI than control and Stat6−/− mice (*P < 0.001 when compared with Stat6−/− and control mice).
Figure 10
Figure 10
Induction of Th2 cytokines by PCN is attenuated in Stat6−/− mice. The amounts of IL-13 and IL-4 in the BAL of control and PCN-exposed wild-type and Stat6−/− mice were quantified by ELISA. A and B: Wild-type mice exposed to sterile H2O (control) or Stat6−/− mice exposed to PCN did not induce IL-13. In contrast, 3 weeks of PCN (25 μg/ml) exposure induced significant expression of IL- 13 (A) and IL-4 (B) in wild-type mouse lungs. *P <0.001. The P values were derived by comparing cytokine levels in the BAL of PCN-exposed wild-type versus wild-type control or Stat6−/− mice. C: Exposure to PCN, IL-4, or IL-13 induced the expression of mucin biosynthesis gene MUC5AC in the human pulmonary mucoepidermoid carcinoma cell line, NCI-H292. D–F: PCN induced the secretion of IL-4 in wild-type C57BL/6 mice (E, arrows) but not in Stat6−/− mice (F). G–I: PCN induced the secretion of IL-13 in wild-type C57BL/6 mice (H, arrows) but not in Stat6−/− mice (I). Wild-type mice exposed to sterile H2O (control) did not elaborate IL-4 or IL-13 (D and G).
Figure 11
Figure 11
Leukocyte subset numbers are mediated by STAT6 in mouse lungs chronically exposed to PCN. A: Three weeks of PCN exposure increases the numbers of nonnaive CD4+ cells significantly in the lungs of wild-type mice but not Stat6−/− mice (**P < 0.01). No significant difference in the numbers of nonnaive CD8+ cells was observed. B: Three weeks of PCN exposure increases the numbers of infiltrating macrophages significantly in the lungs of wild-type mice but not Stat6−/− mice (*P < 0.05). No significant difference in the number of neutrophils was observed. The P values were derived by comparing cells in the BAL of wild-type and Stat6−/− mice exposed to 25 μg/ml PCN.

References

    1. Boucher RC. An overview of the pathogenesis of cystic fibrosis lung disease. Adv Drug Deliv Rev. 2002;54:1359–1371. - PubMed
    1. Lyczak JB, Cannon CL, Pier GB. Lung infections associated with cystic fibrosis. Clin Microbiol Rev. 2002;15:194–222. - PMC - PubMed
    1. Lau GW, Ran H, Hassett DJ, Kong FS. The role of pyocyanin in Pseudomonas aeruginosa infection. Trends Mol Med. 2004;10:599–606. - PubMed
    1. Lau GW, Hassett DJ, Britigan BE. Modulation of lung epithelial functions by Pseudomonas aeruginosa. Trends Microbiol. 2005;13:389–397. - PubMed
    1. Wilson RD, Sykes A, Watson D, Rutman A, Taylor GW, Cole PJ. Measurement of Pseudomonas aeruginosa phenazine pigments in sputum and assessment of their contribution to sputum sol toxicity for respiratory epithelium. Infect Immun. 1988;56:2515–2517. - PMC - PubMed

Publication types

MeSH terms