. 2009 Dec;175(6):2540-56.
doi: 10.2353/ajpath.2009.081096. Epub 2009 Nov 5.

Increased activity and altered subcellular distribution of lysosomal enzymes determine neuronal vulnerability in Niemann-Pick type C1-deficient mice

Affiliations

Increased activity and altered subcellular distribution of lysosomal enzymes determine neuronal vulnerability in Niemann-Pick type C1-deficient mice

Asha Amritraj et al. Am J Pathol. 2009 Dec.

Abstract

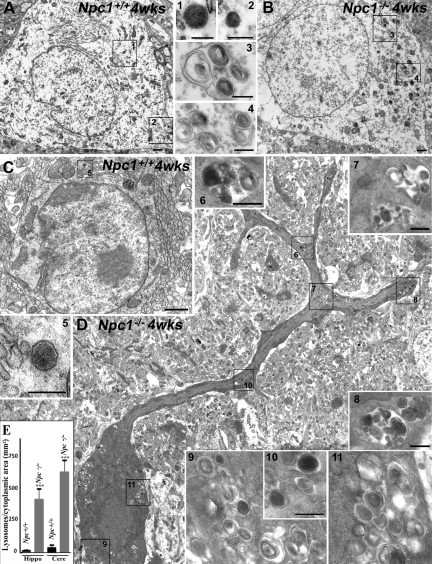
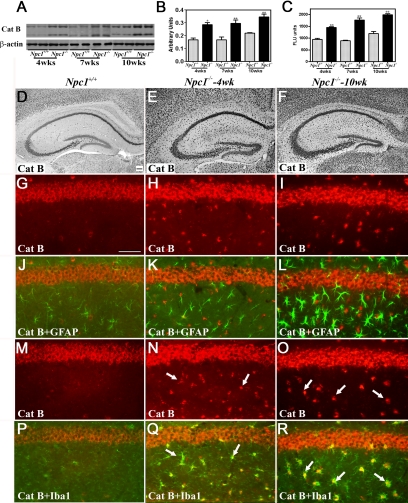
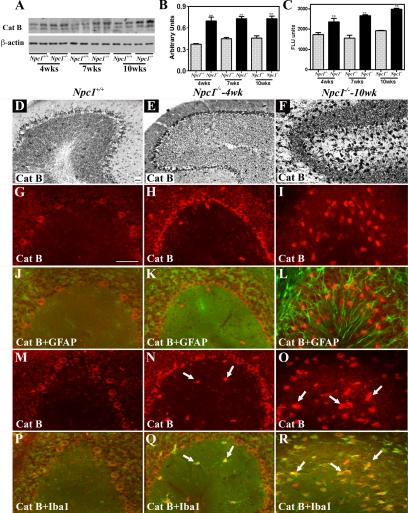
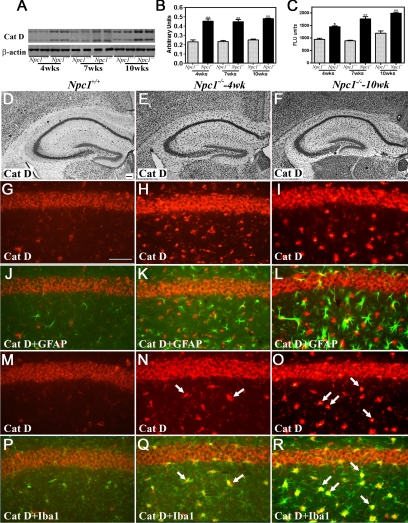
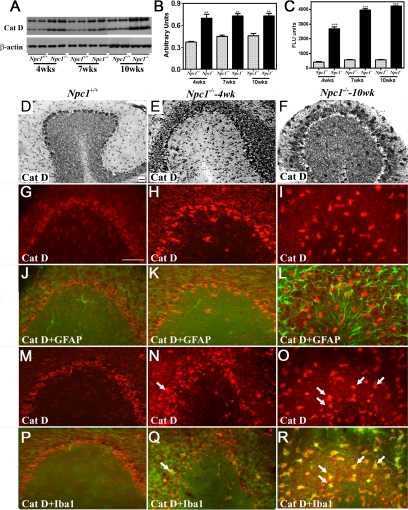
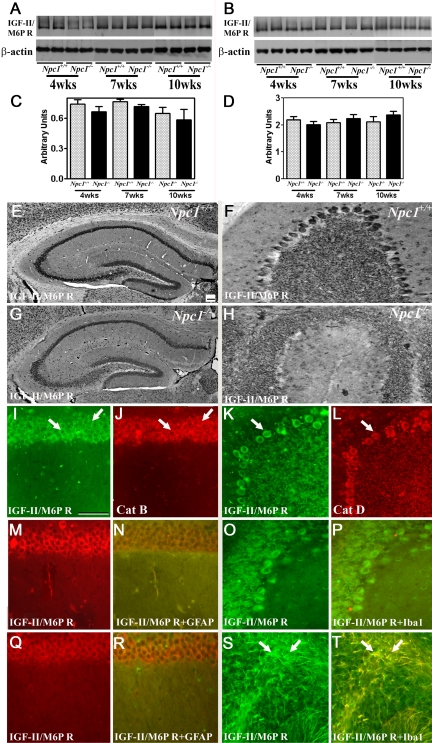
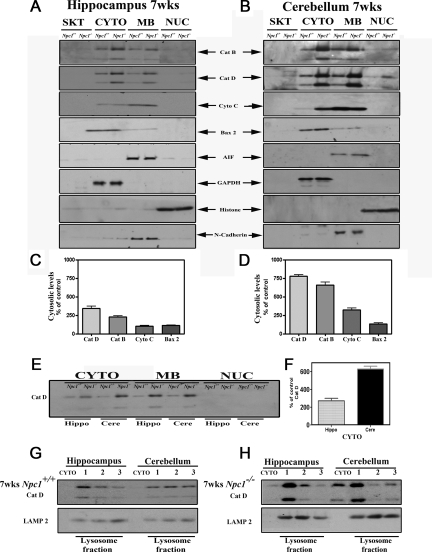
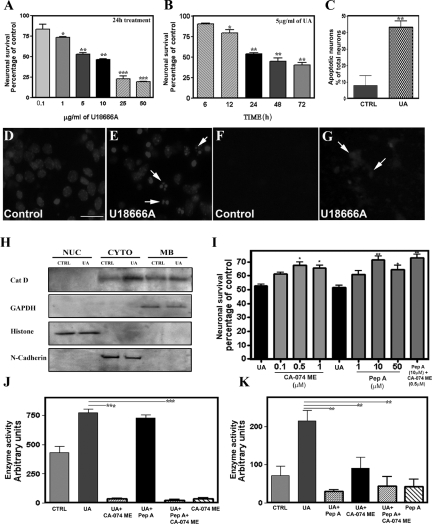
Niemann-Pick disease type C (NPC), caused by mutations in the Npc1 or Npc2 genes, is a progressive neurodegenerative disorder characterized by intracellular accumulation/redistribution of cholesterol in a number of tissues including the brain. This is accompanied by a severe loss of neurons in selected brain regions. In this study, we evaluated the role of lysosomal enzymes, cathepsins B and D, in determining neuronal vulnerability in NPC1-deficient (Npc1(-/-)) mouse brains. Our results showed that Npc1(-/-) mice exhibit an age-dependent degeneration of neurons in the cerebellum but not in the hippocampus. The cellular level/expression and activity of cathepsins B and D are increased more predominantly in the cerebellum than in the hippocampus of Npc1(-/-) mice. In addition, the cytosolic levels of cathepsins, cytochrome c, and Bax2 are higher in the cerebellum than in the hippocampus of Npc1(-/-) mice, suggesting a role for these enzymes in the degeneration of neurons. This suggestion is supported by our observation that degeneration of cultured cortical neurons treated with U18666A, which induces an NPC1-like phenotype at the cellular level, can be attenuated by inhibition of cathepsin B or D enzyme activity. These results suggest that the increased level/activity and altered subcellular distribution of cathepsins may be associated with the underlying cause of neuronal vulnerability in Npc1(-/-) brains. Therefore, their inhibitors may have therapeutic potential in attenuating NPC pathology.


Figures

Figure 1
Figure 1
A and B: Photomicrographs showing the ultrastructure of hippocampal pyramidal cells in 4-week-old (wks) control (Npc1+/+; A) and Npc1−/− (B) mice. In Npc1+/+ mice (A) the pyramidal cell shows the classical ultrastructural morphology characterized by large round nucleus surrounded by a clear cytoplasm containing organelles and sparse primary lysosomes (insets 1 and 2). In Npc1−/− mice (B) there is no evidence of cell degeneration, but the number of lysosomes is relatively higher, and they are characterized by dense concentric lamellar bodies of various sizes and densities (insets 3 and 4). The areas indicated by the rectangles and the numbers are shown at higher magnification in the insets. C and D: Photomicrographs showing the ultrastructure of cerebellar Purkinje cells in 4-week-old control (Npc1+/+; C) and Npc1−/− (D) mice. In Npc1+/+ mice (C) a Purkinje cell shows the classic ultrastructural morphology characterized by a round large nucleus, a clear cytoplasm with organelles, and sparse primary lysosomes (inset 5). In Npc1−/− mice (D) note the evident degeneration of the cell characterized by nuclear condensation and accumulation of lysosomes and vacuoles. Both primary (inset 10) and secondary lysosomes are present in the cytoplasm. In particular, note the large secondary lysosomes with heterogeneous dark content, dense concentric lamellar bodies, and granules of various sizes and densities (insets 6–8 and 9–11). The areas indicated by the rectangles and the numbers are shown at higher magnification in the insets. E: Histograms showing the number of lysosomes/cytoplasmic area in hippocampus and cerebellum of Npc1+/+ and Npc1−/− mice. A significant increase in the number of lysosomes was observed in the hippocampus and cerebellum of Npc1−/− mice. The increase is more evident in Purkinje cells than in pyramidal cells. Hippo, hippocampus; Cere, cerebellum. Scale bars: 1 μm (A and B); 250 nm (insets 1–4); 1 μm (C and D); 250 nm (inset 5); 500 nm (insets 6–8/9 and 11); 250 nm (inset 10). ***P < 0.001.
Figure 2
Figure 2
A–C: Immunoblot (A and B) and enzyme activity (C) assays showing increased levels and activity of cathepsin B in the hippocampus of 4-, 7- and 10-week-old (wks) Npc1−/− mouse brains compared with age-matched controls (Npc1+/+). Histograms represent quantification of cathepsin B levels/activity from at least three separate experiments, each of which was replicated two to three times. D–F: Photomicrographs showing the cellular distribution of the cathepsin B in the hippocampus of the control (Npc1+/+; D) and 4-week-old (E) and 10-week-old (F) Npc1−/− mice. Note the relative change in intensity and distribution of cathepsin B immunoreactivity in the hippocampus of Npc1−/− mouse brains. G–R: Double immunofluorescence photomicrographs of control (Npc1+/+; G, J, M, and P) and 4-week-old (H, K, N, and Q) and 10-week-old (I, L, O, and R) Npc1−/− mouse hippocampus showing the possible colocalization of cathepsin B (G–I and M–O) with GFAP-labeled astrocytes (J–L) and Iba1-labeled microglia (P–R). In Npc1−/− hippocampus a number of microglia (N, Q, O, and R) but not astrocytes (H, K, I, and L) exhibit cathepsin B immunoreactivity (arrows). Cat B, cathepsin B. Scale bar = 25 μm. *P < 0.05; **P < 0.01.
Figure 3
Figure 3
A–C: Immunoblot (A and B) and enzyme activity (C) assays showing increased levels and activity of cathepsin B in the cerebellum of 4-, 7-, and 10-week-old (wks) Npc1−/− mouse brains compared with age-matched controls (Npc1+/+). Histograms represent quantification of cathepsin B levels/activity from at least three separate experiments, each of which was replicated two to three times. D–F: Photomicrographs showing the cellular distribution of the cathepsin B in the cerebellum of the control (Npc1+/+; D) and 4-week-old (E) and 10-week-old (F) Npc1−/− mice. Note the relative change in intensity and distribution of cathepsin B immunoreactivity in the cerebellum of Npc1−/− mouse brains. G–R: Double immunofluorescence photomicrographs of control (Npc1+/+; G, J, M, and P) and 4-week-old (H, K, N, and Q) and 10-week-old (I, L, O, and R) Npc1−/− mouse cerebellum showing the possible colocalization of cathepsin B (G–I and M–O) with GFAP-labeled astrocytes (J–L) and Iba1-labeled microglia (P–R). In Npc1−/− cerebellum a number of microglia (N, Q, O, and R) but not astrocytes (H, K, I, and L) exhibit cathepsin B immunoreactivity (arrows). Cat B, cathepsin B. Scale bar = 25 μm. **P < 0.01.
Figure 4
Figure 4
A–C: Immunoblots (A and B) and enzyme activity (C) assays showing increased levels and activity of cathepsin D in the hippocampus of 4-, 7-, and 10-week-old (wks) Npc1−/− mouse brains compared with age-matched controls (Npc1+/+). Histograms represent quantification of cathepsin D levels/activity from at least three separate experiments, each of which was replicated two to three times. D–F: Photomicrographs showing the cellular distribution of the cathepsin D in the hippocampus of the control (Npc1+/+; D) and 4-week-old (E) and 10-week-old (F) Npc1−/− mice. Note the relative change in intensity and distribution of cathepsin D immunoreactivity in the hippocampus of Npc1−/− mouse brains. G-R: Double immunofluorescence photomicrographs of control (Npc1+/+; G, J, M, and P) and 4-week-old (H, K, N, and Q) and 10-week-old (I, L, O, and R) Npc1−/− mouse hippocampus showing the possible colocalization of cathepsin D (G–I and M–O) with GFAP-labeled astrocytes (J–L) and Iba1-labeled microglia (P–R). In Npc1−/− hippocampus a number of microglia (N, Q, O, and R) but not astrocytes (H, K, I, and L) exhibit cathepsin D immunoreactivity (arrows). Cat D, cathepsin D. Scale bar = 25 μm. *P < 0.05; **P < 0.01.
Figure 5
Figure 5
A–C: Immunoblots (A and B) and enzyme activity (C) assays showing increased levels and activity of cathepsin D in the cerebellum of 4-, 7-, and 10-week-old (wks) old Npc1−/− mouse brains compared with age-matched controls (Npc1+/+). Histograms represent quantification of cathepsin D levels/activity from at least three separate experiments, each of which was replicated two to three times. D–F: Photomicrographs showing the cellular distribution of the cathepsin D in the cerebellum of the control (Npc1+/+; D) and 4-week-old (E) and 10-week-old (F) Npc1−/− mice. Note the relative change in intensity and distribution of cathepsin D immunoreactivity in the cerebellum of Npc1−/− mouse brains. G-R: Double immunofluorescence photomicrographs of control (Npc1+/+; G, J, M, and P) and 4-week-old (H, K, N, and Q) and 10-week-old (I, L, O, and R) Npc1−/− mouse cerebellum showing the possible colocalization of cathepsin D (G–I and M–O) with GFAP-labeled astrocytes (J–L) and Iba1-labeled microglia (P–R). In Npc1−/− cerebellum a number of microglia (N, Q, O, and R) but not astrocytes (H, K, I, and L) exhibit cathepsin D immunoreactivity (arrows). Cat D, cathepsin D. Scale bar = 25 μm. **P < 0.01; ***P < 0.001.
Figure 6
Figure 6
A–D: Immunoblots and respective histograms showing that IGF-II/M6P receptor levels are not significantly altered in the hippocampus (A and C) or cerebellum (B and D) of 4-, 7-, and 10-week-old (wks) Npc1−/− mouse brains compared with age-matched controls (Npc1+/+). Histograms represent quantification of the IGF-II/M6P receptor level from at least three separate experiments, each of which was replicated two to three times. E–H: Photomicrographs showing the cellular distribution of the IGF-II/M6P receptor in the hippocampus (E and G) and cerebellum (F and H) of the control (Npc1+/+; E and F) and 10-week-old (G and H) Npc1−/− mice. Note the relative change in intensity and distribution of the IGF-II/M6P receptor immunoreactivity in the hippocampus and cerebellum of Npc1−/− mouse brains. I–L: Double immunofluorescence photomicrographs of control mouse hippocampus (I and J) and cerebellum (K and L) showing the colocalization (arrows) of the IGF-II/M6P receptor (I and K) with cathepsin B (J) and cathepsin D (L) immunoreactivity. M–T: Double immunofluorescence photomicrographs of control (Npc1+/+; M, N, O, and P) and 10-week-old (Q, R, S, and T) Npc1−/− mouse hippocampus (M, N, Q, and R) and cerebellum (O, P, S, and T) showing the possible colocalization of the IGF-II/M6P receptor (M, Q, O, and S) with lectin-labeled microglia (N and R) and GFAP-labeled astrocytes (P and T). A number of astrocytes (S and T)(arrows) but not microglia (Q and R) exhibit IGF-II/M6P receptor immunoreactivity in Npc1−/− mice. Cat B, cathepsin B; Cat D, cathepsin D. IGF-II/M6PR, IGF-II/M6P receptor. Scale bar = 25 μm.
Figure 7
Figure 7
A–D: Immunoblots (A and B) and respective histograms (C and D) showing subcellular distribution of cathepsin B, cathepsin D, cytochrome c, Bax2, and AIF in the hippocampus and cerebellum of 7-week-old control and Npc1−/− mice. The subcellular fractions were prepared using Qproteome Cell Compartment kit. Note the relatively higher cytosolic levels of cathepsins, cytochrome c, and Bax2 in the cerebellum compared with hippocampus. No marked alterations in AIF levels were evident in Npc1−/− mice compared with controls. Histograms represent quantification of cathepsins, cytochrome c, and Bax2 levels from at least three separate experiments, each of which was replicated two times. E and F: Immunoblot and corresponding histogram showing changes in the subcellular levels of cathepsin D in the hippocampus and cerebellum of 7-week-old control and Npc1−/− mouse brains run on the same gel. Note the relative increase in the cytosolic cathepsin D level in the cerebellum compared with that in the hippocampus. G and H: Immunoblot showing cytosolic and lysosomal levels of cathepsin D in the hippocampus and cerebellum of 7-week-old control (G) and Npc1−/− (H) mouse brains. The lysosomal and cytosolic fractions were prepared using a lysosomal isolation kit. Note the relatively higher cytosolic levels of cathepsin D in the cerebellum compared with hippocampus. Cat B, cathepsin B; Cat D, cathepsin D; Cere, cerebellum; Cyto c, cytochrome c; CYTO, cytoplasmic; GAPDH, glyceraldehyde-3-phosphate dehydrogenase; Hippo, hippocampus; MB, membrane; NUC, nuclear, SKT, cytoskeletal.
Figure 8
Figure 8
A–E: Neurotoxic effects of U18666A on mouse primary cortical cultured neurons as evident by MTT colorimetric assay (A and B) and Hoechst 33258 labeling (C–E). Neurons after 6 days of plating were treated with 0.1 to 50 μg/ml U18666A for 24 hours (A) or with 5 μg/ml U18666A for 6 to 72 hours (B). MTT values, as evident from the histograms, were significantly attenuated in a concentration- (A) and time (B)-dependent manner in U18666A-treated cultures. C: Relative increase in Hoechst 33258-labeled apoptotic neurons after 24 hours exposure to 5 μg/ml U18666A. D and E: Presence of condensed and/or fragmented nuclei (arrows) in U18666A-treated cultured neurons (E) compared with control (D). F and G: Cholesterol accumulation as evident by filipin staining in U18666A-treated cultured neurons (G, arrows) compared with control (F). H: Immunoblots showing the relatively higher cytosolic levels of cathepsin D in U18666A-treated cultured neurons compared with control cultures. I: Protective effects of the cathepsin B inhibitor CA-074 methyl ester and the cathepsin D inhibitor pepstatin A against U18666A-mediated toxicity in cortical cultured neurons as measured using the MTT assay. Note that both CA-074 methyl ester and pepstatin A can independently protect cultured neurons against 5 μg/ml U18666A-mediated toxicity, but their effects were not additive. J and K: Cathepsin B (J) and cathepsin D (K) enzyme activity in cultured neurons treated with 5 μg/ml U18666A either in the presence or absence of CA-074 methyl ester and pepstatin A. The increased enzyme activity observed after exposure to U18666A was significantly attenuated by treatment with CA-074 methyl ester as well as pepstatin A. Also note the attenuation of cathepsin D enzyme activity in cultured neurons treated with U18666A and CA-074 methyl ester. All results, which are presented as means ± SEM, were obtained from three separate experiments, each performed in triplicate. CA-074 ME, CA-074 methyl ester; Cat D, cathepsin D; CTRL, control; CYTO, cytoplasmic; GAPDH, glyceraldehyde-3-phosphate dehydrogenase; MB, membrane; Pep A, pepstatin A; NUC, nuclear; UA, U18666A. Scale bar = 25 μm. *P < 0.05; **P < 0.01; ***P < 0.001.

References

    1. Carstea ED, Morris JA, Coleman KG, Loftus SK, Zhang D, Cummings C, Gu J, Rosenfeld MA, Pavan WJ, Krizman DB, Nagle J, Polymeropoulos MH, Sturley SL, Ioannou YA, Higgins ME, Comly M, Cooney A, Brown A, Kaneski CR, Blanchette-Mackie EJ, Dwyer NK, Neufeld EB, Chang TY, Liscum L, Strauss JF, 3rd, Ohno K, Zeigler M, Carmi R, Sokol J, Markie D, O'Neill RR, van Diggelen OP, Elleder M, Patterson M, Brady RO, Vanier MT, Pentchev PG, Tagle DA. Niemann-Pick C1 disease gene: homology to mediators of cholesterol homeostasis. Science. 1997;277:228–231. - PubMed
    1. Naureckiene S, Sleat DE, Lackland H, Fensom A, Vanier MT, Wattiaux R, Jadot M, Lobel P. Identification of HE1 as the second gene of Niemann-Pick C disease. Science. 2000;290:2298–2301. - PubMed
    1. Vanier MT, Millat G. Niemann-Pick disease type C. Clin Genet. 2003;64:269–281. - PubMed
    1. Walkley SU, Suzuki K. Consequences of NPC1 and NPC2 loss of function in mammalian neurons. Biochim Biophys Acta. 2004;1685:48–62. - PubMed
    1. Pentchev PV, Vanier MT, Suzuki K, Patterson MC. Niemann-Pick disease type C: a cellular cholesterol lipidosis. Scriver CR, Beaudet AL, Sly WD, Valle D, editors. New York: McGraw-Hill,; 1995:pp 2625–2639.

Publication types

MeSH terms