. 2010 Jan 8;285(2):1414-23.
doi: 10.1074/jbc.M109.065615. Epub 2009 Nov 5.

Ku and DNA-dependent protein kinase dynamic conformations and assembly regulate DNA binding and the initial non-homologous end joining complex

Affiliations

Ku and DNA-dependent protein kinase dynamic conformations and assembly regulate DNA binding and the initial non-homologous end joining complex

Michal Hammel et al. J Biol Chem. .

Abstract

DNA double strand break (DSB) repair by non-homologous end joining (NHEJ) is initiated by DSB detection by Ku70/80 (Ku) and DNA-dependent protein kinase catalytic subunit (DNA-PKcs) recruitment, which promotes pathway progression through poorly defined mechanisms. Here, Ku and DNA-PKcs solution structures alone and in complex with DNA, defined by x-ray scattering, reveal major structural reorganizations that choreograph NHEJ initiation. The Ku80 C-terminal region forms a flexible arm that extends from the DNA-binding core to recruit and retain DNA-PKcs at DSBs. Furthermore, Ku- and DNA-promoted assembly of a DNA-PKcs dimer facilitates trans-autophosphorylation at the DSB. The resulting site-specific autophosphorylation induces a large conformational change that opens DNA-PKcs and promotes its release from DNA ends. These results show how protein and DNA interactions initiate large Ku and DNA-PKcs rearrangements to control DNA-PK biological functions as a macromolecular machine orchestrating assembly and disassembly of the initial NHEJ complex on DNA.


Figures

FIGURE 1.
FIGURE 1.
Solution structures of Ku and Ku-DNA complexes. A, experimental scattering profiles of Ku alone (black), Ku with 16-bp Y-DNA (cyan), 40-bp Y-DNA (dark blue), or 40-bp HP-DNA (blue) (see also supplemental Fig. S1). The theoretical scattering from the final MES models for Ku (χ2 = 2.8) and multicomponent model for Ku·DNA assemblies (χ2 = 3.0 for Ku·16-bp Y-DNA; χ2 = 4.5 for Ku·40-bp Y-DNA; χ2 = 7.0 for Ku·40-bp HP-DNA) are shown by the red lines. B, distance distribution functions P(r) of the Ku assemblies computed from experimental SAXS data shown in the same colors as in A. The P(r) functions are normalized to unity at their maxima. C, the average SAXS envelopes of the Ku assemblies calculated with DAMMIN, as displayed in volumetric representation and colored as in A. D, the best fit atomic model of Ku (shown in Fig. 2B) and Ku/16-bp Y-DNA (Ku (green) and DNA (red)) were superimposed with the average SAXS envelopes, displayed in a transparent, volumetric representation.
FIGURE 2.
FIGURE 2.
Atomic models of Ku. A, graph showing a comparison of RG values for all 10,000 models obtained in MD conformational sampling with their maximal dimensions. The values for the best fit model (red dots) and MES ensemble (cyan) with five conformers are indicated. The distribution of RG values (40–54 Å) for MES conformers indicates flexibility of the Ku80CTR. The MES fit to the experimental data is shown in Fig. 1A. B, the best fit model of Ku (χ2 = 4.0) for Ku70 (blue) and Ku80 (cyan) shown schematically. C, five MES-selected conformers (χ2 = 2.8), representing the probable conformational space adopted by the Ku80CTR domain. The positions of the Ku80CTR shown schematically are highlighted (red stars). MES conformers are superimposed on the Ku crystal structure (Protein Data Bank code 1jeq) shown in a surface representation.
FIGURE 3.
FIGURE 3.
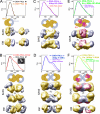
DNA-PKcs solution assemblies with and without DNA. A, top, two P(r) functions for DNA-PKcs alone calculated for two independent data sets shown in supplemental Fig. S3A. Middle, schematic view of DNA-PKcs adapted from cryo-EM reconstructions (41) with colored head (yellow) and palm (blue) regions. SAXS, two views of representative SAXS envelope rotated by 90° with head (yellow) and palm (blue) regions highlighted, as displayed in a volumetric representation. EM, cryo-EM envelopes (rotated by 90°) obtained for DNA-PKcs (41) and colored as above. See supplemental Fig. S4 for added structural analyses. B, DNA-PKcs dimers, showing the P(r) function, a schematic model, two views of representative SAXS envelope, and cryo-EM envelopes as in A. The inset shows the DNA-PKcs dimer described by cryo-EM (44). C, DNA-PKcs plus 40-bp HP-DNA, showing the P(r) function, a schematic model, and two views of representative SAXS envelope, as in A. D, DNA-PKcs plus 40-bp Y-DNA, showing the P(r) function, a schematic model, two views of representative SAXS envelope, and a cryo-EM three-dimensional reconstruction as in A. E, DNA-PKcs·Ku·40-bp HP-DNA, showing the P(r) function, a schematic model, and two views of representative SAXS envelope as in C. Ku is shown in pink/purple in the schematic and the SAXS envelopes. F, DNA-PKcs·Ku·40-bp Y-DNA, showing the P(r) function, a schematic model, two views of representative SAXS envelope, and a reconstructed cryo-EM envelope, obtained for DNA-PKcs·Ku·DNA (40).
FIGURE 4.
FIGURE 4.
Autophosphorylation of DNA-PKcs causes a large conformational change and opening of the structure. A, purified DNA-PKcs and Ku were preincubated in the absence of ATP (control) or in the presence of either ATP or the non-hydrolyzable ATP analogue, AMP-PNP. Reactions were analyzed by SDS-PAGE and Western blot using an antibody to amino acids 2016–2136 of DNA-PKcs (see the supplemental material for details). The box highlights the region of the gel corresponding to the putative conformational change. B, P(r) functions calculated for the two data sets measured for DNA-PKcs (red and black) and two data sets measured for phospho-DNA-PKcs (P-DNA-PKcs) (orange and blue). Corresponding SAXS profiles are shown in supplemental Fig. S11. C, single (top) and average (bottom) SAXS envelope for DNA-PKcs (yellow, blue) and phospho-DNA-PKcs (orange, gold) are displayed in a clipped volumetric representation. Head and palm regions are highlighted. The enclosed cavity in the head region, which can be localized in the SAXS and EM envelopes (see Ref. 41), is highlighted by the green arrow. Unclipped envelopes are shown in the middle panel. D, schematic model describing proposed conformational changes during autophosphorylation of DNA-PKcs.

Similar articles

Cited by

References

    1. Hall E. J., Giaccia A. J. (2006) Radiobiology for the Radiobiologist, 6th Ed., pp. 16–46, Lippincott Williams & Wilkins, Philadelphia
    1. Helleday T., Lo J., van Gent D. C., Engelward B. P. (2007) DNA Repair 6, 923–935 - PubMed
    1. Löbrich M., Jeggo P. A. (2007) Nat. Rev. Cancer 7, 861–869 - PubMed
    1. O'Driscoll M., Jeggo P. A. (2006) Nat. Rev. Genet 7, 45–54 - PubMed
    1. Mahaney B. L., Meek K., Lees-Miller S. P. (2009) Biochem. J. 417, 639–650 - PMC - PubMed

Publication types