. 2010 Jan;5(1):42-7.
doi: 10.1038/nnano.2009.314. Epub 2009 Nov 1.

Design considerations for tumour-targeted nanoparticles

Affiliations

Design considerations for tumour-targeted nanoparticles

Hak Soo Choi et al. Nat Nanotechnol. 2010 Jan.

Abstract

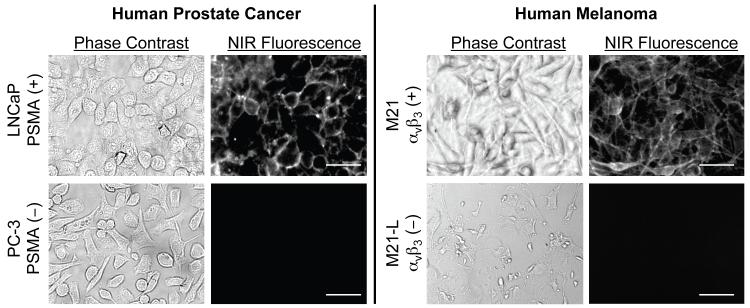
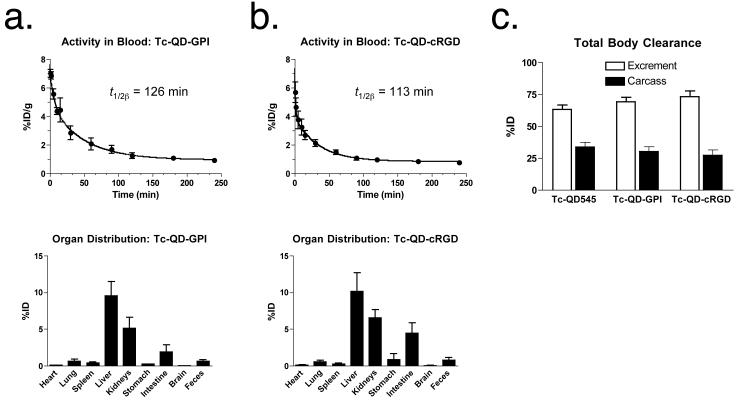
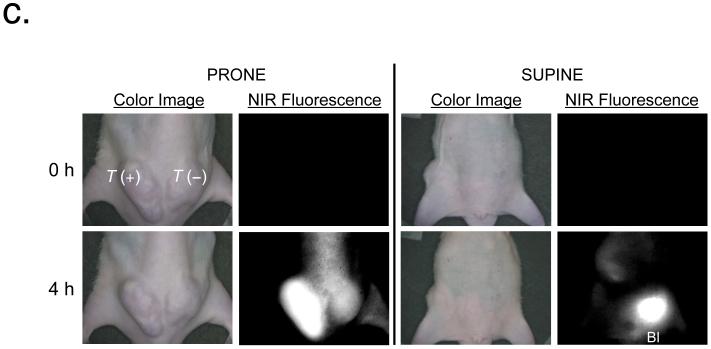
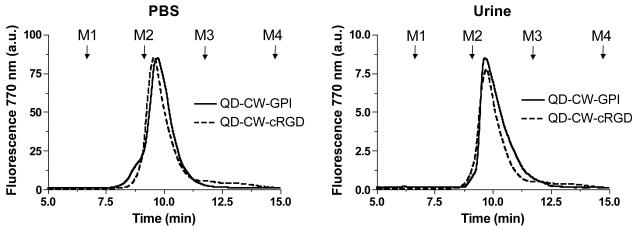
Inorganic/organic hybrid nanoparticles are potentially useful in biomedicine, but to avoid non-specific background fluorescence and long-term toxicity, they need to be cleared from the body within a reasonable timescale. Previously, we have shown that rigid spherical nanoparticles such as quantum dots can be cleared by the kidneys if they have a hydrodynamic diameter of approximately 5.5 nm and a zwitterionic surface charge. Here, we show that quantum dots functionalized with high-affinity small-molecule ligands that target tumours can also be cleared by the kidneys if their hydrodynamic diameter is less than this value, which sets an upper limit of 5-10 ligands per quantum dot for renal clearance. Animal models of prostate cancer and melanoma show receptor-specific imaging and renal clearance within 4 h post-injection. This study suggests a set of design rules for the clinical translation of targeted nanoparticles that can be eliminated through the kidneys.


Figures

Figure 1
Figure 1
Design and characterization of nanoparticles. a, Chemical conjugation of targeting ligands (R) and NIR fluorophores with cysteine-coated CdSe(ZnCdS) core(shell) QDs. b, Absorption (Abs) and fluorescence (FL) emission (λExc = 532 nm) spectra (top panels) of QD545 (left) and QD-CW (right). Gel-filtration chromatography (mobile phase = PBS, pH 7.4) analysis (bottom panels) of the different nanoparticles in PBS (left) and after 4 h incubation in 100% mouse serum (right). λExc = 532 nm. Molecular weight markers M1 (γ-globulin; 158 kDa, 11.9 nm HD), M2 (ovalbumin; 44 kDa, 6.13 nm HD), M3 (myoglobin; 17 kDa, 3.83 nm HD), and M4 (vitamin B12, 1.35 kDa, 1.48 nm) are shown by arrows.
Figure 1
Figure 1
Design and characterization of nanoparticles. a, Chemical conjugation of targeting ligands (R) and NIR fluorophores with cysteine-coated CdSe(ZnCdS) core(shell) QDs. b, Absorption (Abs) and fluorescence (FL) emission (λExc = 532 nm) spectra (top panels) of QD545 (left) and QD-CW (right). Gel-filtration chromatography (mobile phase = PBS, pH 7.4) analysis (bottom panels) of the different nanoparticles in PBS (left) and after 4 h incubation in 100% mouse serum (right). λExc = 532 nm. Molecular weight markers M1 (γ-globulin; 158 kDa, 11.9 nm HD), M2 (ovalbumin; 44 kDa, 6.13 nm HD), M3 (myoglobin; 17 kDa, 3.83 nm HD), and M4 (vitamin B12, 1.35 kDa, 1.48 nm) are shown by arrows.
Figure 2
Figure 2
Live cell binding of targeted QDs in vitro: NIR fluorescence imaging of QD-CW-GPI after incubation with PSMA-positive LNCaP and PSMA-negative PC-3 prostate cancer cells (left), and of QD-CW-cRGD after incubation with αvβ3-positive M21 and αvβ3-negative M21-L melanoma cells (right). For each are shown phase contrast (left) and NIR fluorescence (right) images. Fluorescence images have identical exposure times and normalizations. Scale bar = 10 μm.
Figure 3
Figure 3
Total body clearance of targeted nanoparticles 4 h post-intravenous injection into CD-1 mice. Each data point is the mean ± S.D. from n = 4 animals. Blood concentration (%ID/g) and organ distributions (%ID) for 99mTc-QD-GPI (a) and 99mTc-QD-cRGD (b). c, Elimination in excrement (white) and retained dose in carcass (black) of 99mTc-QD545, 99mTc-QD-GPI, and 99mTc-QD-cRGD.
Figure 4
Figure 4
In vivo fluorescence imaging of human prostate cancer and melanoma xenograft tumors. a, 10 pmol/g (0.2 μg/g) of QD-CW-GPI was injected intravenously and observed for 4 h. The PSMA-positive LNCaP tumor (T+) and PSMA-negative PC-3 tumor (T-) are indicated. Shown are representative (n = 5 animals) images of color video (left) and NIR fluorescence (right) for animals in prone (left) or supine (right) position. b, In situ (top row) and resected (bottom row) organs from (a) were imaged 4 h post-injection with color video (left) and NIR fluorescence (right). c, 10 pmol/g (0.2 μg/g) of QD-CW-cRGD was injected intravenously and observed for 4 h. The αvβ3-positive M21 tumor (T+) and αvβ3-negative M21-L tumor (T-) are indicated. Shown are representative (n = 5 animals) images of color video (left) and NIR fluorescence (right) for animals in prone (left) or supine (right) position. d, In situ (top row) and resected (bottom row) organs from (c) were imaged 4 h post-injection with color video (left) and NIR fluorescence (right). Ki, kidneys; Du, duodenum; Sp, spleen; In, intestine; Lu, lungs; Li, liver; Pa, pancreas; Ab, abdominal wall; and Bl, bladder.
Figure 4
Figure 4
In vivo fluorescence imaging of human prostate cancer and melanoma xenograft tumors. a, 10 pmol/g (0.2 μg/g) of QD-CW-GPI was injected intravenously and observed for 4 h. The PSMA-positive LNCaP tumor (T+) and PSMA-negative PC-3 tumor (T-) are indicated. Shown are representative (n = 5 animals) images of color video (left) and NIR fluorescence (right) for animals in prone (left) or supine (right) position. b, In situ (top row) and resected (bottom row) organs from (a) were imaged 4 h post-injection with color video (left) and NIR fluorescence (right). c, 10 pmol/g (0.2 μg/g) of QD-CW-cRGD was injected intravenously and observed for 4 h. The αvβ3-positive M21 tumor (T+) and αvβ3-negative M21-L tumor (T-) are indicated. Shown are representative (n = 5 animals) images of color video (left) and NIR fluorescence (right) for animals in prone (left) or supine (right) position. d, In situ (top row) and resected (bottom row) organs from (c) were imaged 4 h post-injection with color video (left) and NIR fluorescence (right). Ki, kidneys; Du, duodenum; Sp, spleen; In, intestine; Lu, lungs; Li, liver; Pa, pancreas; Ab, abdominal wall; and Bl, bladder.
Figure 5
Figure 5
HD measurements of renally excreted QDs: QD-CW-GPI (solid curve) and QD-CW-cRGD (dotted curve) in PBS (left) and in urine collected 4 h post-injection (right). λExc = 770 nm. Molecular weight markers (arrows) are as described in Fig. 1b.

References

    1. Frangioni JV. New technologies for human cancer imaging. J Clin Oncol. 2008;26:4012–4021. - PMC - PubMed
    1. Choi HS, et al. Renal clearance of quantum dots. Nat Biotechnol. 2007;25:1165–1170. - PMC - PubMed
    1. Alivisatos P. The use of nanocrystals in biological detection. Nat Biotechnol. 2004;22:47–52. - PubMed
    1. Gao X, Cui Y, Levenson RM, Chung LW, Nie S. In vivo cancer targeting and imaging with semiconductor quantum dots. Nat Biotechnol. 2004;22:969–976. - PubMed
    1. Michalet X, et al. Quantum dots for live cells, in vivo imaging, and diagnostics. Science. 2005;307:538–544. - PMC - PubMed

Publication types