. 2009 Nov;5(11):e1000707.
doi: 10.1371/journal.pgen.1000707. Epub 2009 Nov 6.

The germ cell nuclear proteins hnRNP G-T and RBMY activate a testis-specific exon

Affiliations

The germ cell nuclear proteins hnRNP G-T and RBMY activate a testis-specific exon

Yilei Liu et al. PLoS Genet. 2009 Nov.

Abstract

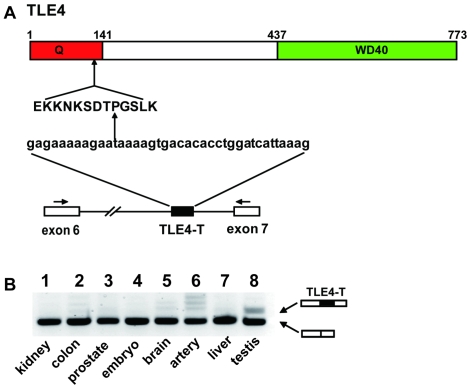
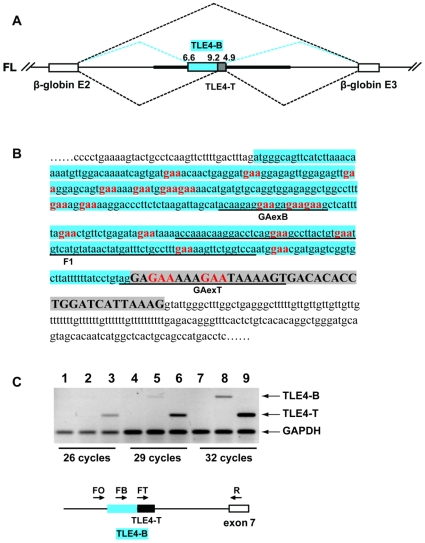
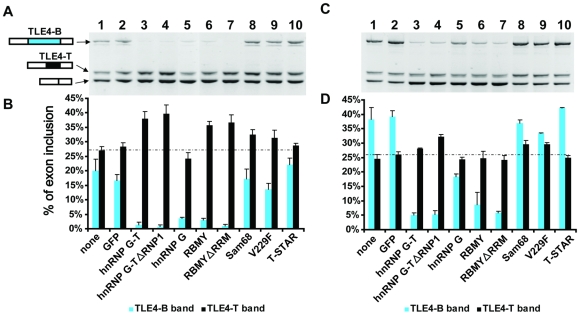
The human testis has almost as high a frequency of alternative splicing events as brain. While not as extensively studied as brain, a few candidate testis-specific splicing regulator proteins have been identified, including the nuclear RNA binding proteins RBMY and hnRNP G-T, which are germ cell-specific versions of the somatically expressed hnRNP G protein and are highly conserved in mammals. The splicing activator protein Tra2beta is also highly expressed in the testis and physically interacts with these hnRNP G family proteins. In this study, we identified a novel testis-specific cassette exon TLE4-T within intron 6 of the human transducing-like enhancer of split 4 (TLE4) gene which makes a more transcriptionally repressive TLE4 protein isoform. TLE4-T splicing is normally repressed in somatic cells because of a weak 5' splice site and surrounding splicing-repressive intronic regions. TLE4-T RNA pulls down Tra2beta and hnRNP G proteins which activate its inclusion. The germ cell-specific RBMY and hnRNP G-T proteins were more efficient in stimulating TLE4-T incorporation than somatically expressed hnRNP G protein. Tra2b bound moderately to TLE4-T RNA, but more strongly to upstream sites to potently activate an alternative 3' splice site normally weakly selected in the testis. Co-expression of Tra2beta with either hnRNP G-T or RBMY re-established the normal testis physiological splicing pattern of this exon. Although they can directly bind pre-mRNA sequences around the TLE4-T exon, RBMY and hnRNP G-T function as efficient germ cell-specific splicing co-activators of TLE4-T. Our study indicates a delicate balance between the activity of positive and negative splicing regulators combinatorially controls physiological splicing inclusion of exon TLE4-T and leads to modulation of signalling pathways in the testis. In addition, we identified a high-affinity binding site for hnRNP G-T protein, showing it is also a sequence-specific RNA binding protein.


Conflict of interest statement

The authors have declared that no competing interests exist.

Figures

Figure 1
Figure 1. An alternative exon in the TLE4 gene is specifically spliced in the human testis.
(A) Cartoon of the TLE4 gene protein showing the N-terminal Glutamine rich (Q) domain and the C-terminal WD40 domain. A testis-specific exon between exons 6 and 7 of the human TLE4 gene inserts an extra 39 nucleotides encoding 13 amino acids into the TLE4 protein. (B) Tissue distribution of the TLE4-T exon assayed in a panel of RNAs made from human tissues. The positions of the primers used for RT–PCR are shown as arrows above exons 6 and 7. On the agarose gel, the upper band corresponds to the product including the TLE4-T exon, while the lower band corresponds to the RT–PCR product resulting from direct splicing between exons 6 and 7. The TLE4-T splice isoform is specifically enriched in the testis.
Figure 2
Figure 2. TLE4-T exon modulates the activity of the cognate TLE4 protein.
(A) Over-expression of the human TLE4(T) mRNA isoform has a stronger ventralising effect than the ubiquitously expressed TLE4 mRNA on early zebrafish development. A spectrum of phenotypes was observed ranging from normal to very strongly ventralised. Representative embryos in each class of embryo are shown. The percentage of different phenotypes observed in the zebrafish embryos after mRNA injection are shown as a bar chart, with colours black, blue, yellow and red corresponding to the proportion of phenotypes C1–C4 respectively. C1 represents normal development, C2 represents weak ventralisation (smaller eyes and enlarged blood island are pointed out by red arrows), C3 represents strong ventralisation (as shown by loss of eyes and hugely enlarged blood island, red arrows), C4 represents early developmental arrest at blastula stage. Embryos of C1, C2, and C3 are shown in lateral view with anterior to the left and dorsal to the top. (B) Injection of the human TLE4-T mRNA isoform into zebrafish embryos has a stronger repressive effect on expression of the Wnt/β-catenin target gene dharma than injection of the TLE4 mRNA isoform. Embryos representing the different dharma expression patterns C1–C3 are shown. The percentage of different blastocyst dharma expression phenotypes is shown as a bar chart, with colours black, blue and red corresponding to the proportion of phenotypes C1–C3 respectively. Embryos are shown in lateral view with animal pole to the top and dorsal to the right. Scale bars represent 250 µm in (A) and (B). (C) TOPFLASH assay in zebrafish embryos. Relative luciferase activity represents the relative Wnt/β-catenin signalling activity in zebrafish embryos receiving different mRNAs. After injection of 100 pg Topflash reporter and 10 pg Renilla reporter, either 800 pg TLE4 mRNA or 800 pg TLE4(T) mRNA was injected into each embryo. The vertical bar represents mean relative luciferase activity ± SD.
Figure 3
Figure 3. Structure of the minigene designed to analyse TLE4 pre–mRNA splicing.
(A) Cartoon of minigene in which exon TLE4-T and the flanking introns were cloned into pXJ41 to give the FL minigene. The exons are shown as boxes, and the introns as lines. The TLE4 flanking intron fragments are shown as a thicker line. mRNAs composed of three different combinations of exons were made from this minigene. The β-globin exons could be directly spliced together (upper broken line), with TLE4-T exon spliced in between (bottom broken line), or with a longer TLE4 alternative exon called TLE4-B spliced into the minigene encoded mRNA (middle blue broken line). (B) The nucleotide sequence of the TLE4-T exon (highlighted grey) and the TLE4-B exon (specific TLE4-B region highlighted blue; notice that the TLE4-B exon also uses the same 5′ splice site as TLE4-T). The GAA motifs are in bold red, although there are further GA-rich motifs that could be additional Tra2β binding sites. The immediately flanking intron sequences are shown in lower case unshaded. The TLE4-B exon contains stop codons which would truncate the TLE4 reading frame, while the TLE4-T exon maintains the open reading frame. Probes used for UV crosslinking experiments are underlined. (C) RT–PCR experiment on endogenous human testis RNA showing the TLE4-B transcript is expressed at much lower level than the TLE4-T transcript in the human testis. Three PCR reactions using one of the forward primers FO, FB, FT, together with the reverse primer R were performed for 3 different cycle numbers, quantitatively showing the abundance of transcripts containing TLE4-B (lanes 2, 5, 8) and TLE4-T (lanes 3, 6, 9) relative to GAPDH. The lower panel shows the position of the primers relative to the exons assayed. Lanes 1, 4, 7 are negative control using primer FO which is located immediately upstream of B exon 3′ splice site.
Figure 4
Figure 4. Splicing of the TLE4-T exon is repressed in somatic cells.
(A) Schematic diagrams show the structures of the full length minigene TLE4-T (FL) and 10 small minigenes (B1-S4) with partially truncated introns (drawn to scale). The primers used to clone these minigenes are shown on top of the minigenes except, due to limited space, for primer R5 which is almost coincident with R2. R5 was used as the reverse primer of B1, S6 and S7. The putative intronic repressive elements are labelled by asterisks. (B) RT–PCR analysis showing the splicing pattern of each of the minigenes in HEK293 cells. (C) Histogram showing the average TLE4-T exon inclusions from 3 independent sets of RT–PCR experiments.
Figure 5
Figure 5. Analysis of the proteins which bind to the TLE4-T exon.
Transcribed RNAs corresponding to the TLE4-T exon and the negative control (GST-89) were immobilised on beads and incubated in nuclear extracts made from untransfected HeLa cells. (A) Silver stained gel of proteins bound to the two RNA sequences. Strong protein bands that differentially bound to TLE4-T and the control RNA were identified by mass spectroscopy and are labelled with protein names. (B) Pull down samples were analysed by Western blotting with antibodies specific for splicing factors. Proteins labelled in red showed more significant binding to the TLE4-T exon than to the control RNA sequence.
Figure 6
Figure 6. Splicing of TLE4-T is up-regulated by hnRNP G family proteins, Tra2β, and STAR family proteins.
Western blot (A), RT–PCR electrophoresis (B) and densitometry (C) analysis of HEK293 cells transfected with the TLE4 FL minigene by itself, or the FL minigene cotransfected with GFP or different splicing factors fused to GFP. The same samples in different panels are lined up, and the cotransfected splicing factors are indicated at the bottom of panel (C). (A) Western blot of transfected cells showing expression levels of each of the transfected, epitope tagged proteins compared to endogenous actin protein. The amounts of transfected DNA were adjusted to give similar levels of protein expression over multiple replicate experiments. (B) Analysis of TLE4 minigene splicing patterns assayed by RT–PCR and agarose gel electrophoresis. (C) Bar chart showing the densitometric analysis of the percentage of the two alternative splice isoforms. The broken line in the bar chart represents the average level of TLE4-T splicing detected when the minigene was transfected by itself into HEK293 cells.
Figure 7
Figure 7. Identification and dissection of a direct binding site for hnRNP G-T downstream of TLE4-T.
(A) Cartoon of the TLE4-T exon and flanking introns showing the position of each of the in vitro transcribed RNAs F1 to F5 which were used in the EMSA experiments. (B) Mapping of interactions of RBMY, hnRNP G, and hnRNP G-T with each of the fragments F1 to F5 using EMSA. In each binding reaction, there is either no protein (lane 1) or the RRM of RBMY (Y) (30 ng at lane 2, 100 ng at lane 3), hnRNP G (G) (30 ng at lane 4, 100 ng at lane 5), and hnRNP G-T (G-T) (30 ng at lane 6, 100 ng at lane 7) was added. The positive control for RBMY protein-RNA binding is in vitro transcribed S1A RNA. The negative control for RBMY-RNA binding is S1Amut, in which the RBMY binding site is mutated. (C) High resolution mapping and dissection of the hnRNP G-T protein binding site identified in the in vitro transcribed RNA F4. The sequences of each of the in vitro transcribed RNAs are shown underneath a representative gel showing a complete set of interactions measured by EMSA.
Figure 8
Figure 8. UV-crosslinking assay validating the direct binding of Tra2β to TLE4-T and TLE4-B exons.
The bands showing the crosslinking of exogenous Tra2β and ASF/SF2 to the transcripts are indicated by black triangles and stars, respectively. The black dots label the RNA transcripts bound by a protein that most likely corresponds to endogenous Tra2β. No significant crosslinking to any of the RNA probes was detected in the absence of transfected Tra2β (lanes 1, 4, 7, 10 and 13), whereas a strong crosslinking was detected to a (GAA)6 sequence probe which is a canonical Tra2β binding site (lane 11). Moderately strong crosslinking was detected to the GA(A) repeat sequence from TLE4-T (lane 8), and very strong crosslinking to the GA(A) repeat sequence from TLE4-B (lane 5). As a control, no crosslinking was detected to the ABwt probe, which contains the binding site of hnRNP G-T from the intron downstream of TLE-T (lane 14), and very weak crosslinking to the F1 probe which has a few dispersed GA(A) repeats (lane 2). ASF/SF2 bound most strongly to GAexB, but much less efficiently to GAexT. The sequences of F1, GAexB, GAexT are underlined in Figure 3B; the ABwt sequence is given in Figure 7C.
Figure 9
Figure 9. The balance of specific hnRNP G family proteins controls the splicing pattern of TLE4 pre–mRNA.
RT–PCR analysis of the splicing pattern of the TLE4-T minigene from cells cotransfected with different splicing factors (indicated at the bottom of panel B or D) along with a constant amount of Tra2β (500 ng) (A) or with an increased constant amount of Tra2β (1 µg) (C) respectively. (B) and (D) Bar chart showing quantitation data. The same samples in different panels are lined up. The broken line in the bar chart represents the average level of TLE4-T splicing detected when the minigene was transfected by itself into HEK293 cells.
Figure 10
Figure 10. Model showing the splicing regulation of TLE4-T by hnRNP G proteins and Tra2β.
(A) High levels of hnRNP G family protein expression lead to splicing activation of the TLE4-T exon. The hnRNP G proteins do not directly bind to RNA, but activate splicing indirectly through an RRM-independent mechanism. Here a bridging protein is shown as X. (B) High levels of Tra2β lead to strong activation of the TLE4-B 3′ splice site. As a consequence of the increased nuclear concentration of Tra2β protein, the multiple GAA-rich binding sites in the TLE4 pre-mRNA are occupied by Tra2β protein. We have directly mapped one of the TLE4-B and the TLE4-T Tra2β-binding site by crosslinking. (C) If both Tra2β and hnRNP G family proteins are expressed, these two sets of proteins will mutually antagonise each other. Any surplus hnRNP G protein or Tra2β will be then able to activate splicing of TLE4-T. In this case the hnRNP G family proteins are shown activating splicing of this exon.

Similar articles

Cited by

References

    1. Wang HY, Xu X, Ding JH, Bermingham JR, , Jr., Fu XD. SC35 plays a role in T cell development and alternative splicing of CD45. Mol Cell. 2001;7:331–342. - PubMed
    1. Ding JH, Xu XD, Yang DM, Chu PH, Dalton ND, et al. Dilated cardiomyopathy caused by tissue-specific ablation of SC35 in the heart. Embo Journal. 2004;23:885–896. - PMC - PubMed
    1. Xu XD, Yang DM, Ding JH, Wang W, Chu PH, et al. ASF/SF2-Regulated CaMKII delta alternative splicing temporally reprograms excitation-contraction coupling in cardiac muscle. Cell. 2005;120:59–72. - PubMed
    1. Castle JC, Zhang C, Shah JK, Kulkarni AV, Kalsotra A, et al. Expression of 24,426 human alternative splicing events and predicted cis regulation in 48 tissues and cell lines. Nat Genet. 2008;40:1416–1425. - PMC - PubMed
    1. Clark TA, Schweitzer AC, Chen TX, Staples MK, Lu G, et al. Discovery of tissue-specific exons using comprehensive human exon microarrays. Genome Biol. 2007;8:R64. - PMC - PubMed

Publication types

MeSH terms