

The Sir2-Sum1 complex represses transcription using both promoter-specific and long-range mechanisms to regulate cell identity and sexual cycle in the yeast Kluyveromyces lactis
- PMID: 19893609
- PMCID: PMC2762165
- DOI: 10.1371/journal.pgen.1000710
The Sir2-Sum1 complex represses transcription using both promoter-specific and long-range mechanisms to regulate cell identity and sexual cycle in the yeast Kluyveromyces lactis
Abstract
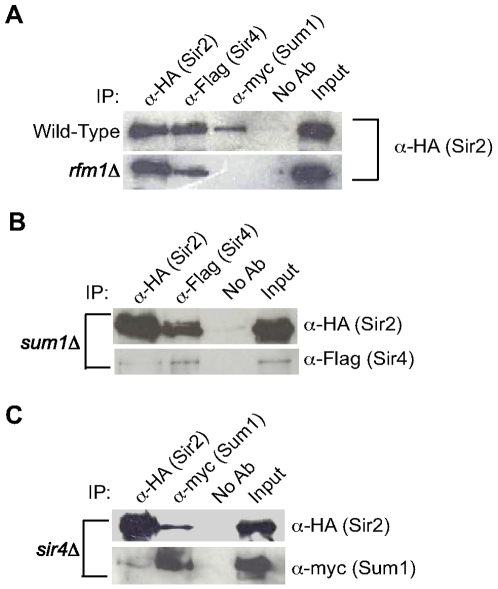
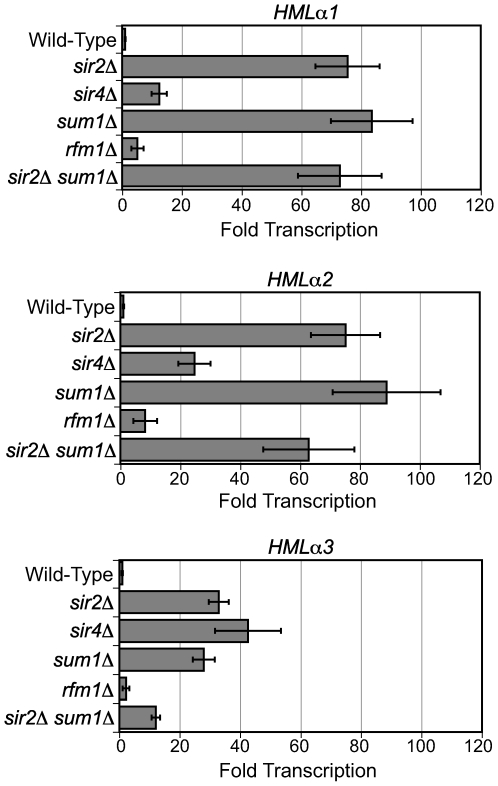
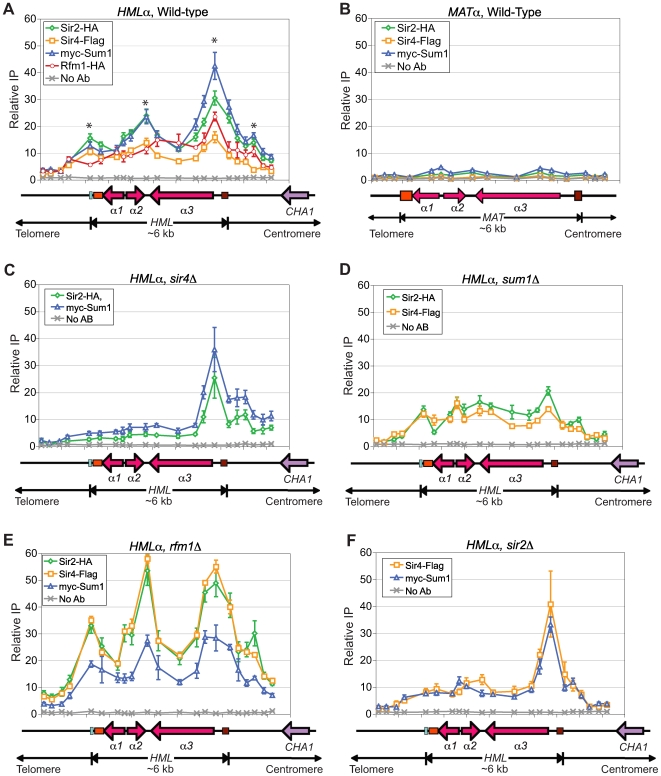
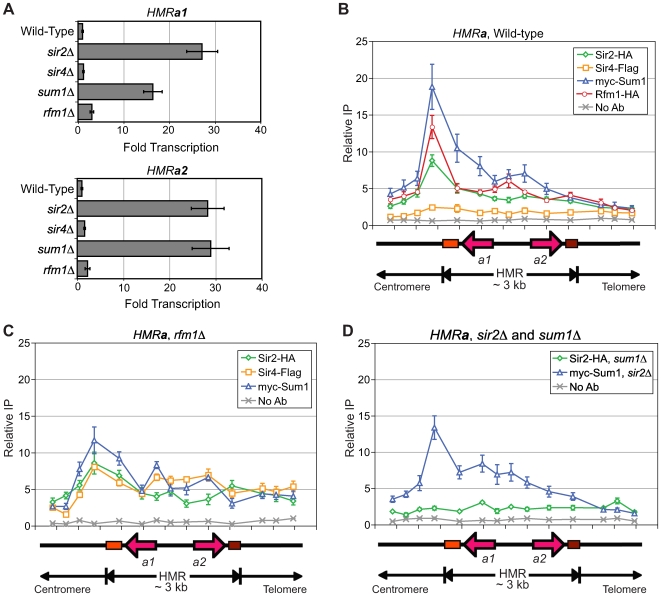
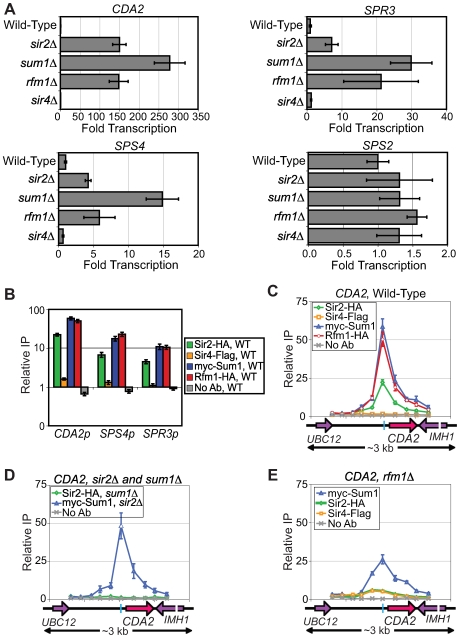
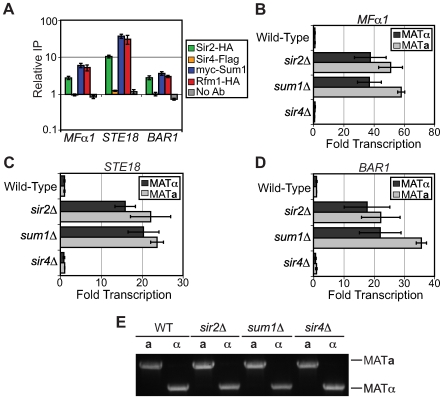
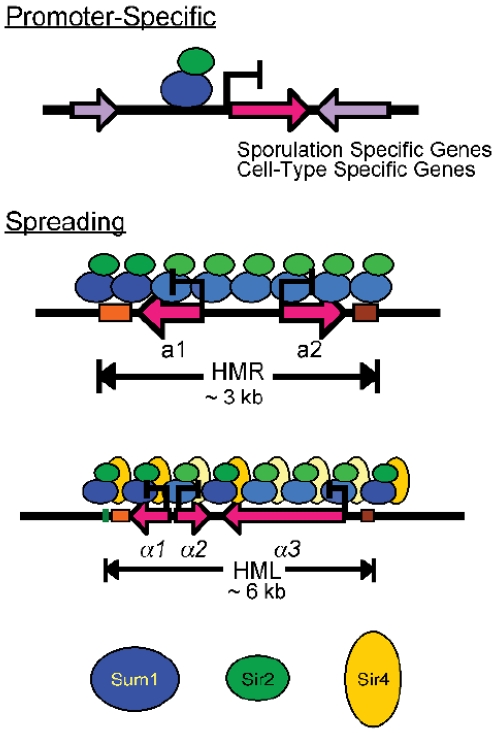
Deacetylases of the Sir2 family regulate lifespan and response to stress. We have examined the evolutionary history of Sir2 and Hst1, which arose by gene duplication in budding yeast and which participate in distinct mechanisms of gene repression. In Saccharomyces cerevisiae, Sir2 interacts with the SIR complex to generate long-range silenced chromatin at the cryptic mating-type loci, HMLalpha and HMRa. Hst1 interacts with the SUM1 complex to repress sporulation genes through a promoter-specific mechanism. We examined the functions of the non-duplicated Sir2 and its partners, Sir4 and Sum1, in the yeast Kluyveromyces lactis, a species that diverged from Saccharomyces prior to the duplication of Sir2 and Hst1. KlSir2 interacts with both KlSir4 and KlSum1 and represses the same sets of target genes as ScSir2 and ScHst1, indicating that Sir2 and Hst1 subfunctionalized after duplication. However, the KlSir4-KlSir2 and KlSum1-KlSir2 complexes do not function as the analogous complexes do in S. cerevisiae. KlSir4 contributes to an extended repressive chromatin only at HMLalpha and not at HMRa. In contrast, the role of KlSum1 is broader. It employs both long-range and promoter-specific mechanisms to repress cryptic mating-type loci, cell-type-specific genes, and sporulation genes and represents an important regulator of cell identity and the sexual cycle. This study reveals that a single repressive complex can act through two distinct mechanisms to regulate gene expression and illustrates how mechanisms by which regulatory proteins act can change over evolutionary time.
Conflict of interest statement
The authors have declared that no competing interests exist.
Figures
Similar articles
-
Substitution as a mechanism for genetic robustness: the duplicated deacetylases Hst1p and Sir2p in Saccharomyces cerevisiae.PLoS Genet. 2007 Aug;3(8):e126. doi: 10.1371/journal.pgen.0030126. PLoS Genet. 2007. PMID: 17676954 Free PMC article.
-
The duplicated deacetylases Sir2 and Hst1 subfunctionalized by acquiring complementary inactivating mutations.Mol Cell Biol. 2011 Aug;31(16):3351-65. doi: 10.1128/MCB.05175-11. Epub 2011 Jun 20. Mol Cell Biol. 2011. PMID: 21690292 Free PMC article.
-
Kluyveromyces lactis Sir2p regulates cation sensitivity and maintains a specialized chromatin structure at the cryptic alpha-locus.Genetics. 2000 Sep;156(1):81-91. doi: 10.1093/genetics/156.1.81. Genetics. 2000. PMID: 10978277 Free PMC article.
-
Local and regional chromatin silencing in Candida glabrata: consequences for adhesion and the response to stress.FEMS Yeast Res. 2015 Sep;15(6):fov056. doi: 10.1093/femsyr/fov056. Epub 2015 Jun 29. FEMS Yeast Res. 2015. PMID: 26122277 Review.
-
SIR-nucleosome interactions: structure-function relationships in yeast silent chromatin.Gene. 2013 Sep 15;527(1):10-25. doi: 10.1016/j.gene.2013.05.088. Epub 2013 Jun 18. Gene. 2013. PMID: 23791651 Review.
Cited by
-
Transcriptional silencing functions of the yeast protein Orc1/Sir3 subfunctionalized after gene duplication.Proc Natl Acad Sci U S A. 2010 Nov 9;107(45):19384-9. doi: 10.1073/pnas.1006436107. Epub 2010 Oct 25. Proc Natl Acad Sci U S A. 2010. PMID: 20974972 Free PMC article.
-
The deacetylase Sir2 from the yeast Clavispora lusitaniae lacks the evolutionarily conserved capacity to generate subtelomeric heterochromatin.PLoS Genet. 2013 Oct;9(10):e1003935. doi: 10.1371/journal.pgen.1003935. Epub 2013 Oct 31. PLoS Genet. 2013. PMID: 24204326 Free PMC article.
-
An Evolutionary Perspective on Yeast Mating-Type Switching.Genetics. 2017 May;206(1):9-32. doi: 10.1534/genetics.117.202036. Genetics. 2017. PMID: 28476860 Free PMC article. Review.
-
Mating-type genes and MAT switching in Saccharomyces cerevisiae.Genetics. 2012 May;191(1):33-64. doi: 10.1534/genetics.111.134577. Genetics. 2012. PMID: 22555442 Free PMC article. Review.
-
Ume6 is required for the MATa/MATalpha cellular identity and transcriptional silencing in Kluyveromyces lactis.Genetics. 2010 Apr;184(4):999-1011. doi: 10.1534/genetics.110.114678. Epub 2010 Feb 5. Genetics. 2010. PMID: 20139343 Free PMC article.
References
-
- Longo VD, Kennedy BK. Sirtuins in aging and age-related disease. Cell. 2006;126:257–268. - PubMed
-
- Denu JM. The Sir 2 family of protein deacetylases. Curr Opin Chem Biol. 2005;9:431–440. - PubMed
-
- Buck SW, Gallo CM, Smith JS. Diversity in the Sir2 family of protein deacetylases. J Leukoc Biol. 2004;75:939–950. - PubMed
-
- Verdin E, Dequiedt F, Fischle W, Frye R, Marshall B, et al. Measurement of mammalian histone deacetylase activity. Methods Enzymol. 2004;377:180–196. - PubMed
-
- Brachmann CB, Sherman JM, Devine SE, Cameron EE, Pillus L, et al. The SIR2 gene family, conserved from bacteria to humans, functions in silencing, cell cycle progression, and chromosome stability. Genes Dev. 1995;9:2888–2902. - PubMed
Publication types
MeSH terms
Substances
Grants and funding
LinkOut - more resources
Full Text Sources
Molecular Biology Databases
