. 2009 Oct 23:3:32.
doi: 10.3389/neuro.09.032.2009. eCollection 2009.

Applications of multivariate pattern classification analyses in developmental neuroimaging of healthy and clinical populations

Affiliations

Applications of multivariate pattern classification analyses in developmental neuroimaging of healthy and clinical populations

Signe Bray et al. Front Hum Neurosci. .

Abstract

Analyses of functional and structural imaging data typically involve testing hypotheses at each voxel in the brain. However, it is often the case that distributed spatial patterns may be a more appropriate metric for discriminating between conditions or groups. Multivariate pattern analysis has been gaining traction in neuroimaging of adult healthy and clinical populations; studies have shown that information present in neuroimaging data can be used to decode intentions and perceptual states, as well as discriminate between healthy and diseased brains. While few studies to date have applied these methods in pediatric populations, in this review we discuss exciting potential applications for studying both healthy, and aberrant, brain development. We include an overview of methods and discussion of challenges and limitations.

Keywords: MRI; clinical; development; fMRI; multivariate pattern classification.


Figures

Figure 1
Figure 1
Example workflow for pattern classification analysis. (A) Preprocessing of fMRI data can follow that used for conventional GLM analyses, consisting of slice-timing correction, realignment, and optional spatial normalization and smoothing steps. However, while the GLM can reduce potential noise sources by including signals such as motion parameters and physiological noise models as covariates in the GLM design matrix, MVPA does not typically have a framework for modeling confounds. Thus, when applying MVPA to the raw time-series, expected confounds should be removed from the data prior to performing MVPA, such as by obtaining the residuals from a regression over the nuisance variables. In addition, if the features are activation patterns (parameter estimates for a particular model), one may wish to first run a GLM analysis on the fMRI data and extract the relevant contrast estimates. (B) Next, the pre-processed data should be transformed into “feature vectors”. This involves creating, for each data point (e.g., subject) a vector in which the ith entry corresponds to the value of the ith feature for that data point. Feature selection may be applied to reduce the number of entries in the feature vectors. (C) At this stage, one may choose to run an unsupervised learning algorithm to characterize patterns in the data, or to run a supervised learning algorithm in conjunction with cross-validation. The parameters of the trained model can be examined for further insight, and the model may also be applied to make predictions on additional datasets so as to further explore its generalization ability.
Figure 2
Figure 2
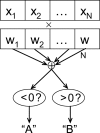
Schematic of linear classification. Each feature (xi) of the data point (x1,…,xN) is multiplied by its respective weight (wi), and the summation of the resulting terms (y^=ixiwi) is evaluated. The classifier predicts that the data point is in “class A” if y^<0, and “class B” if y^>0.
Figure 3
Figure 3
Pattern classification results for FXS versus TD/DD; classification rates above 90% were achieved in this analysis. Whole-brain representation of pattern classification results from FXS versus TD or DD using all gray matter voxels. Axial brain images of weight vectors from leave-one-out support vector machine analysis for all voxels (top) and spatial patterns of the most significant voxels when thresholded at P = 0.05 (according to 2000 permutations) (bottom) are shown. Reprinted with permission from Hoeft et al. (2008). Copyright © 2008 American Medical Association. All rights reserved.

References

    1. Ashburner J., Friston K. J. (2000). Voxel-based morphometry – the methods. Neuroimage 11, 805–82110.1006/nimg.2000.0582 - DOI - PubMed
    1. Bandettini P. A. (2009). What's New in Neuroimaging Methods? Year in Cognitive Neuroscience 2009. Oxford, Blackwell Publishing, pp. 260–293
    1. Beckmann C. F., DeLuca M., Devlin J. T., Smith S. M. (2005). Investigations into resting-state connectivity using independent component analysis. Philos. Trans. R. Soc. Lond., B, Biol. Sci. 360, 1001–101310.1098/rstb.2005.1634 - DOI - PMC - PubMed
    1. Bengtsson S. L., Nagy Z., Skare S., Forsman L., Forssberg H., Ullen F. (2005). Extensive piano practicing has regionally specific effects on white matter development. Nat. Neurosci. 8, 1148–115010.1038/nn1516 - DOI - PubMed
    1. Bergstrand S., Bjornsdotter Aberg M., Niiniskorpi T., Wessberg J. (2009). Towards unified analysis of EEG and fMRI: a comparison of classifiers for single-trial pattern recognition. In Proceedings of the Second International Conference on Bio-inspired Systems and Signal Processing, Encarnação P., Veloso A. , eds (Porto, Institute for Systems and Technologies of Information, Control and Communication; ), pp. 273–278

LinkOut - more resources