. 2009 Sep-Oct;14(5):054049.
doi: 10.1117/1.3251044.

Evans blue dye-enhanced capillary-resolution photoacoustic microscopy in vivo

Affiliations

Evans blue dye-enhanced capillary-resolution photoacoustic microscopy in vivo

Junjie Yao et al. J Biomed Opt. 2009 Sep-Oct.

Abstract

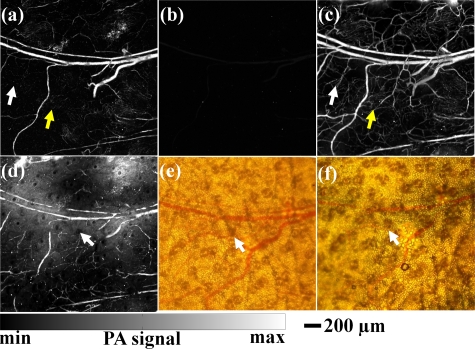
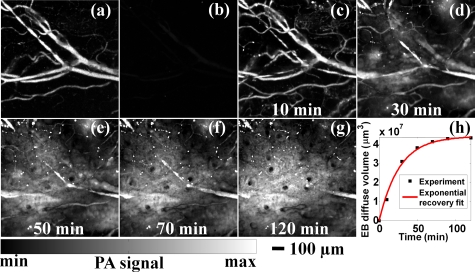
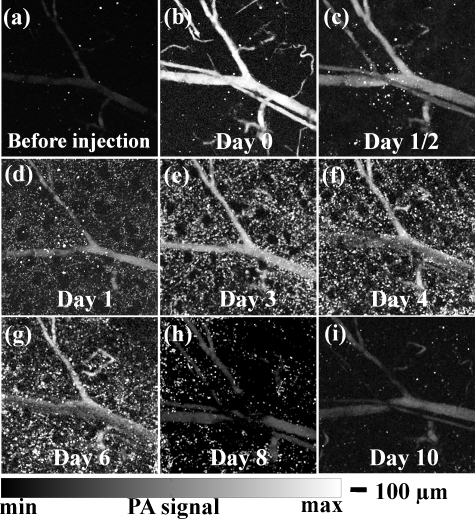
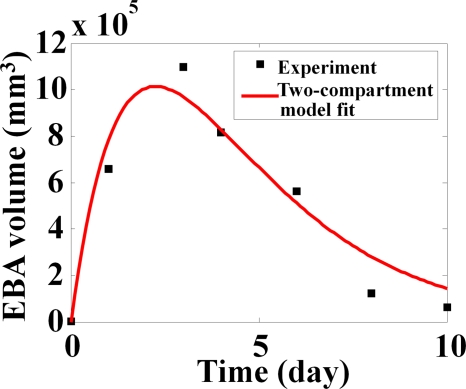
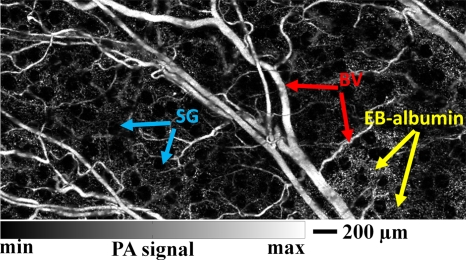
Complete and continuous imaging of microvascular networks is crucial for a wide variety of biomedical applications. Photoacoustic tomography can provide high resolution microvascular imaging using hemoglobin within red blood cells (RBCs) as an endogenic contrast agent. However, intermittent RBC flow in capillaries results in discontinuous and fragmentary capillary images. To overcome this problem, we use Evans blue (EB) dye as a contrast agent for in vivo photoacoustic imaging. EB has strong optical absorption and distributes uniformly in the blood stream by chemically binding to albumin. With the help of EB, complete and continuous microvascular networks--especially capillaries--are imaged. The diffusion dynamics of EB leaving the blood stream and the clearance dynamics of the EB-albumin complex are also quantitatively investigated.


Figures

Figure 1
Figure 1
EB enhanced photoacoustic imaging of mouse ear microvessels. PA microvascular image before dye injection acquired at (a) 570 nm and at (b) 610 nm. Arrows in (a) point to the fragmentary capillaries. (c) PA image acquired at 610 nm right after EB (6%, 0.2 mL) injection via tail vein. Arrows in (c) point to the continuous capillaries. (d) PA image acquired at 610 nm acquired 30 min after injection. Transmission microscopic images of the same area (e) before and (f) after injection. Arrows in (d), (e), and (f) point to sebaceous glands. All the photoacoustic images were scaled to the same level of PA signal.
Figure 2
Figure 2
Dynamics of EB diffusion out of the blood stream into surrounding tissue. PA images acquired before EB injection at (a) 570 nm and at (b) 610 nm (c) through (g) PA images acquired at 610 nm after EB (6%, 0.1 mL) injection at different times. (h) Partial volume of EB diffused into surrounding tissue. An exponential recovery model was used to fit the experiment data. All the photoacoustic images were scaled to the same level.
Figure 3
Figure 3
Clearance dynamics of EBA. Before EB injection, (a) was acquired at 610 nm. On 1∕2 to 10 days following EB (3%, 0.05 mL) injection, images (b) through (i) were acquired at 610 nm. All the photoacoustic images were scaled to the same level.
Figure 4
Figure 4
Quantitative analysis of EBA clearance. After EB (3%, 0.05 mL) injection, the diffused EBA volume in the surrounding tissue reached maximum on day 3, and decayed to the baseline by day 10. A two-compartment model was used to fit the experiment data.
Figure 5
Figure 5
Imaging sensitivity when a low concentration of EB was used. The image was acquired at 570 nm on day 2 after 0.02 mL of 0.3% EB solution was injected. BV is the blood vessel and SG is the sebaceous gland.
Video 1
Video 1
A volumetric visualization of the images before dye injection at 570 nm and after dye injection at 610 nm (MOV, 0.9 MB). .
Video 2
Video 2
A volumetric visualization of the dynamics of EB diffusion at 610 nm (QuickTime, 0.9 MB)..
Video 3
Video 3
A volumetric visualization of the dynamics of EBA clearance at 610 nm (QuickTime, 0.9 MB)..
Video 4
Video 4
A volumetric visualization of the image by using low concentration EB (QuickTime, 1.4 MB)..

References

    1. Xu M. H. and Wang L. H. V., “Photoacoustic imaging in biomedicine,” Rev. Sci. Instrum. RSINAK 77(4), 041101 (2006).10.1063/1.2195024 - DOI
    1. Zhang H. F., Maslov K., Stoica G., and Wang L. H. V., “Functional photoacoustic microscopy for high-resolution and noninvasive in vivo imaging,” Nat. Biotechnol. NABIF9 24(7), 848–851 (2006).10.1038/nbt1220 - DOI - PubMed
    1. Wang L. V., “Tutorial on photoacoustic microscopy and computed tomography,” IEEE J. Sel. Top. Quantum Electron. IJSQEN 14(1), 171–179 (2008).10.1109/JSTQE.2007.913398 - DOI
    1. Wang L. V., “Prospects of photoacoustic tomography,” Med. Phys. MPHYA6 35(12), 5758–5767 (2008).10.1118/1.3013698 - DOI - PMC - PubMed
    1. Li M. L., Oh J. T., Xie X. Y., Ku G., Wang W., Li C., Lungu G., Stoica G., and Wang L. V., “Simultaneous molecular and hypoxia imaging of brain tumors in vivo using spectroscopic photoacoustic tomography,” Proc. IEEE IEEPAD 96(3), 481–489 (2008).10.1109/JPROC.2007.913515 - DOI

Publication types