. 2009 Nov 6:10:370.
doi: 10.1186/1471-2105-10-370.

Elucidation of functional consequences of signalling pathway interactions

Affiliations

Elucidation of functional consequences of signalling pathway interactions

Adaoha E C Ihekwaba et al. BMC Bioinformatics. .

Abstract

Background: A great deal of data has accumulated on signalling pathways. These large datasets are thought to contain much implicit information on their molecular structure, interaction and activity information, which provides a picture of intricate molecular networks believed to underlie biological functions. While tremendous advances have been made in trying to understand these systems, how information is transmitted within them is still poorly understood. This ever growing amount of data demands we adopt powerful computational techniques that will play a pivotal role in the conversion of mined data to knowledge, and in elucidating the topological and functional properties of protein - protein interactions.

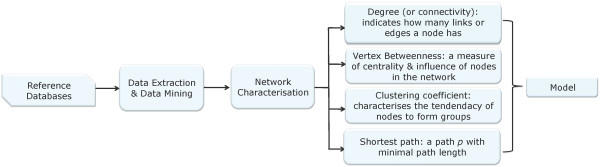
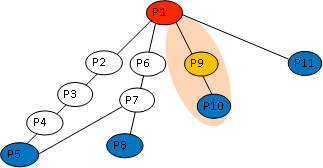
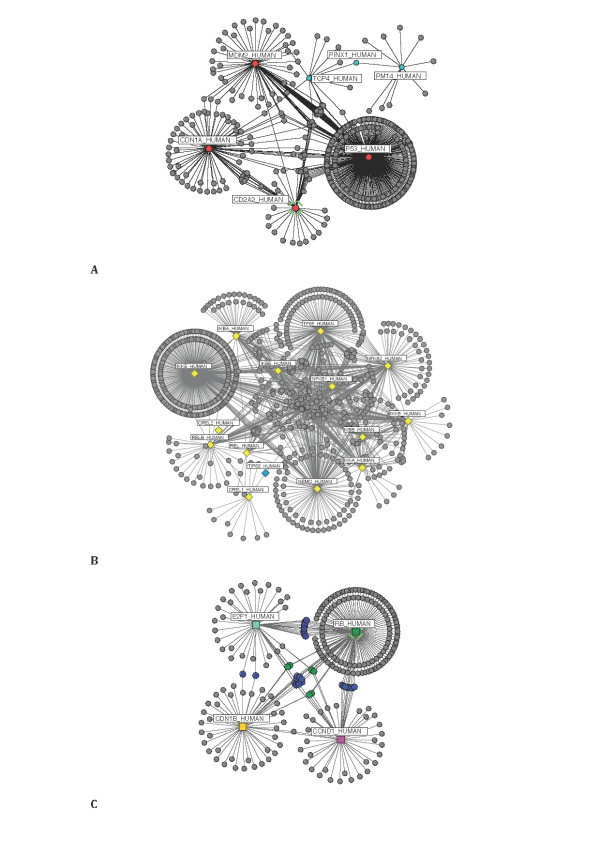
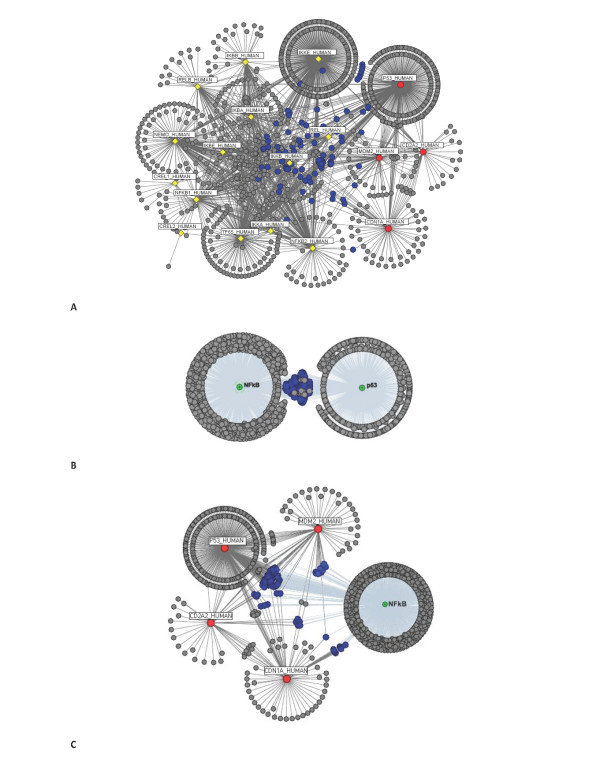
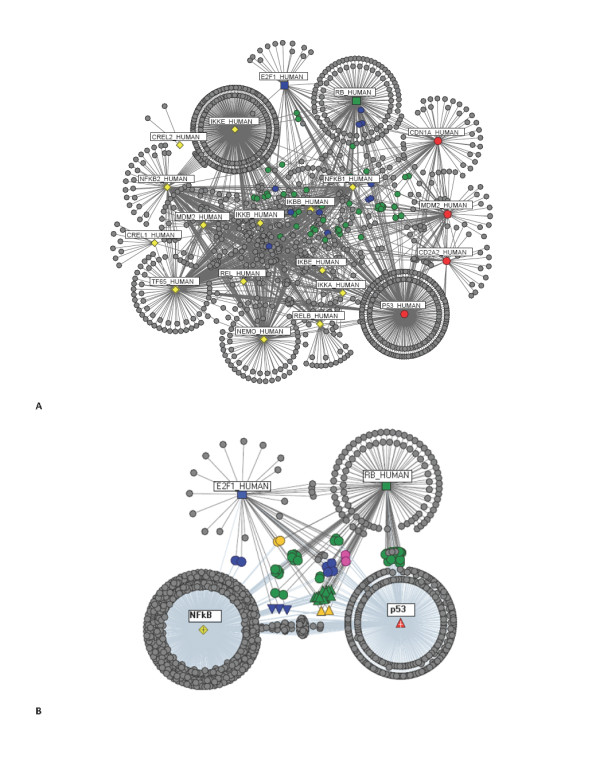
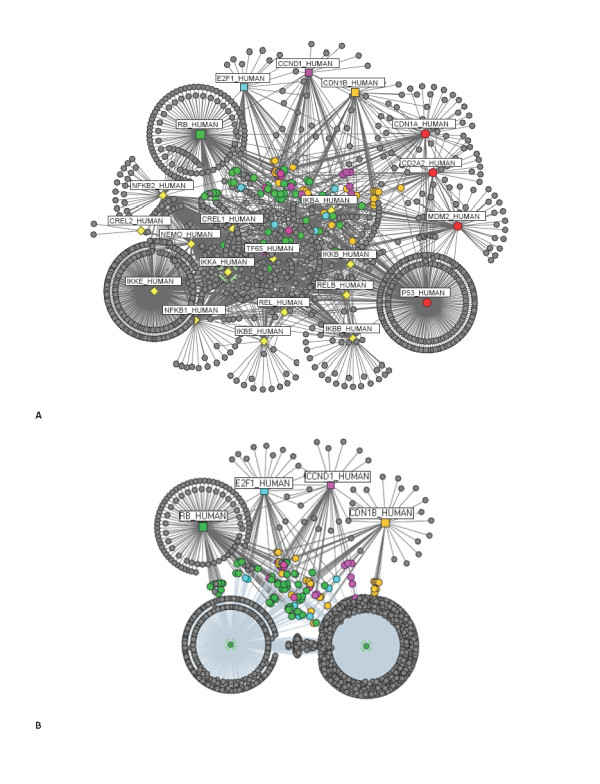
Results: A computational framework is presented which allows for the description of embedded networks, and identification of common shared components thought to assist in the transmission of information within the systems studied. By employing the graph theories of network biology - such as degree distribution, clustering coefficient, vertex betweenness and shortest path measures - topological features of protein-protein interactions for published datasets of the p53, nuclear factor kappa B (NF-kappaB) and G1/S phase of the cell cycle systems were ascertained. Highly ranked nodes which in some cases were identified as connecting proteins most likely responsible for propagation of transduction signals across the networks were determined. The functional consequences of these nodes in the context of their network environment were also determined. These findings highlight the usefulness of the framework in identifying possible combination or links as targets for therapeutic responses; and put forward the idea of using retrieved knowledge on the shared components in constructing better organised and structured models of signalling networks.

Conclusion: It is hoped that through the data mined reconstructed signal transduction networks, well developed models of the published data can be built which in the end would guide the prediction of new targets based on the pathway's environment for further analysis. Source code is available upon request.


Figures

Figure 1
Figure 1
A Schematic representation of the modelling framework introduced.
Figure 2
Figure 2
Diagram of the shortest path calculation. An Illustration showing how the shortest path discussed in the report is calculated. It is assumed that; from P1 to P5: p1 = (P1-P6-P7-P5) and l1 = 3. From P1 to P8: p2 = (P1-P6-P7-P8) and l2 = 3. From P1 to P10: p3 = (P1-P9- P10) and l3 = 2. From P1 to P11: p4 = (P1-P11) and l4 = 1.
Figure 3
Figure 3
Network representation of isolated p53, NF-κB and cell cycle systems. A graphical representation of the (A) p53, (B) NF-κB, and (C) the G1/S transition phase of the cell cycle {RB_HUMAN, E2F1_HUMAN, CDN1B_HUMAN and CCND1_HUMAN} networks. The proteins are represented in the form of nodes, and their interactions in the form of edges. For the cell cycle network (C), the shared components linking RB_HUMAN, E2F1_HUMAN, CDN1B_HUMAN and CCND1_HUMAN to one another are highlighted (in green), and are six in number (i.e. three pairs). RB_HUMAN, CCND1_HUMAN and CDN1B_HUMAN connect with each other by CDK4_HUMAN and CDK2_HUMAN. RB_HUMAN, E2F1_HUMAN and CDN1B_HUMAN are linked together by CCNA1_HUMAN and SKP2_HUMAN. And finally RB_HUMAN, CDN1B_HUMAN, E2F1_HUMAN and CCND1_HUMAN link up with BRCA1_HUMAN and SP1_HUMAN as their connecting components.
Figure 4
Figure 4
A system of p53 and NF-κB. A unified network of the (A) p53 (red circles) and NF-κB (yellow diamonds) networks, with their shared components clearly defined (in blue). (B) Condensed view of the two networks; and in (C) only the NF-κB network, which allows for a better visualisation of the connections.
Figure 5
Figure 5
p53 and NF-κB with RB_HUMAN and E2F1_HUMAN. (A) Members of p53 (red circles) and NF-κB (yellow diamonds) networks, their connections with RB_HUMAN (green square) and E2F1_HUMAN (blue square}) cell cycle proteins, and the common components shared between them. Components connecting RB_HUMAN with p53 and NF-κB networks are denoted in green, whilst the components connecting E2F1_HUMAN with the two networks are denoted in blue. (B) A condensed view of only the p53 and NF-κB networks, and their interactions with RB_HUMAN and E2F1_HUMAN proteins. Triangular connector nodes represent common components between RB_HUMAN and the two networks (in green), E2F1_HUMAN and the two networks (in blue), and RB_HUMAN and E2F1_HUMAN connections with the NF-κB and p53 networks (in yellow). Circular nodes in green denote RB_HUMAN connectors to p53 or NF-κB networks; and in blue for E2F1_HUMAN to p53 or NF-κB networks. The yellow and magenta circular nodes represent proteins connecting both E2F1_HUMAN and RB_HUMAN to members of the NF-κB (in yellow) and p53 (in magenta). Refer also to Tables 9, 10, 11, 12 and 13 for further information.
Figure 6
Figure 6
Network representation of p53, NF-κB and cell cycle interactions. (A) Network topology of the combined networks of the p53 (red), NF-κB (yellow) and the cell cycle {CDN1B_HUMAN (orange), CCND1_HUMAN (magenta), RB_HUMAN (green), E2F1_HUMAN (blue)}. Connector nodes linking cell cycle proteins to either NF-κB or p53; or to both have been denoted according to the colour of the cell cycle protein counterpart. For example, since E2F1_HUMAN is denoted in blue, connector proteins linking it to the p53 or NF-κB, or to both will be highlighted in blue (B) Condensed view of the p53 and NF-κB networks, and their connections with cell cycle proteins. The connectors have been labelled according to (A).

References

    1. Everitt BS. Cluster Analysis. London: Edward Arnold; 1993.
    1. Alberts B, Bray D, Lewis J, Raff M, Roberts K. Molecular biology of the cell. 4. Garland publishing; 2002.
    1. Nicolau M, Tibshirani R, Borresen-Dale AL, Jeffrey SS. Disease-specific genomic analysis: identifying the signature of pathologic biology. Bioinformatics. 2007;23(8):957–965. doi: 10.1093/bioinformatics/btm033. - DOI - PubMed
    1. Goldbeter A. Computational approaches to cellular rhythms. Nature. 2002;420(6912):238–245. doi: 10.1038/nature01259. - DOI - PubMed
    1. Nelson DE, Ihekwaba AE, Elliott M, Johnson JR, Gibney CA, Foreman BE, Nelson G, See V, Horton CA, Spiller DG. Oscillations in NF-kappaB signaling control the dynamics of gene expression. Science. 2004;306(5696):704–708. doi: 10.1126/science.1099962. - DOI - PubMed

Publication types