. 2010 Jan 29;395(4):686-704.
doi: 10.1016/j.jmb.2009.10.063. Epub 2009 Nov 3.

Molecular evolution of multisubunit RNA polymerases: structural analysis

Affiliations

Molecular evolution of multisubunit RNA polymerases: structural analysis

William J Lane et al. J Mol Biol. .

Abstract

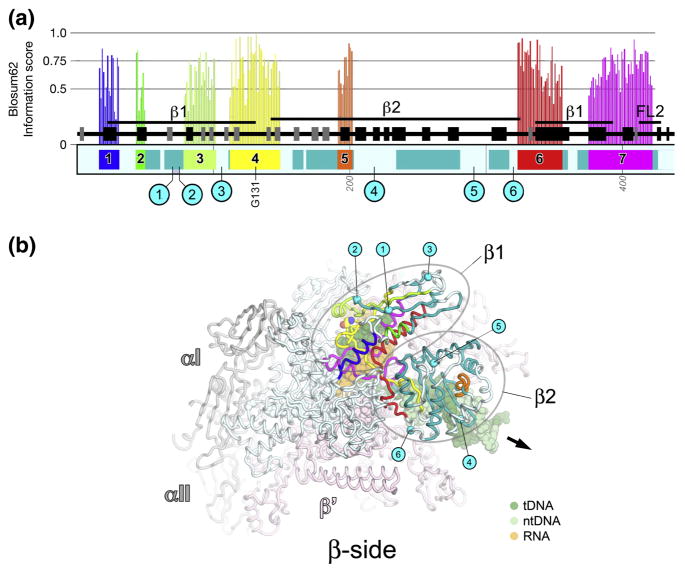
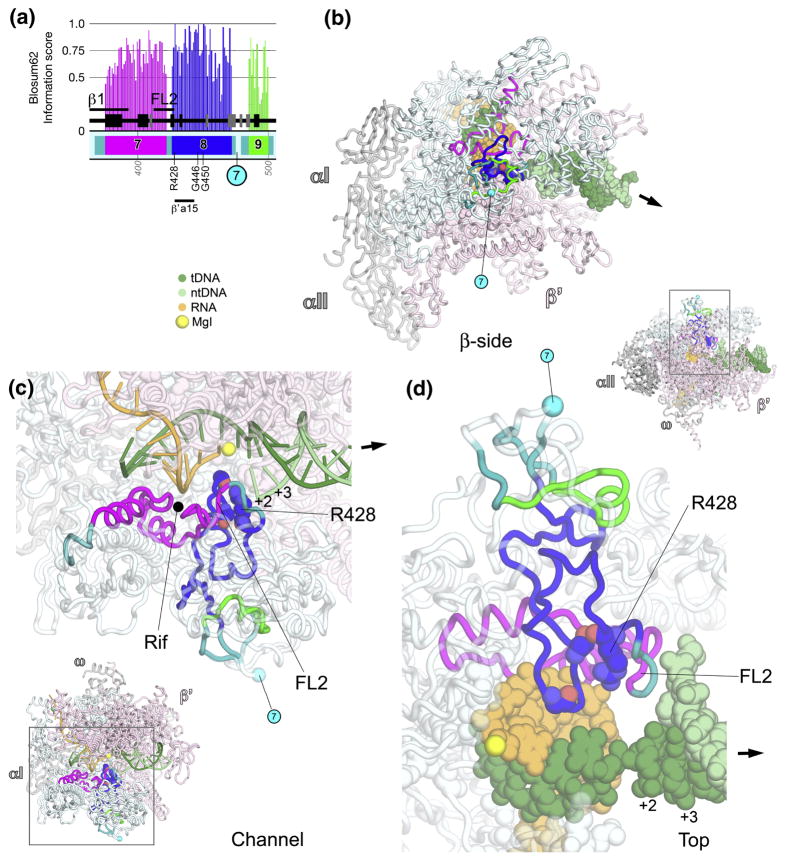
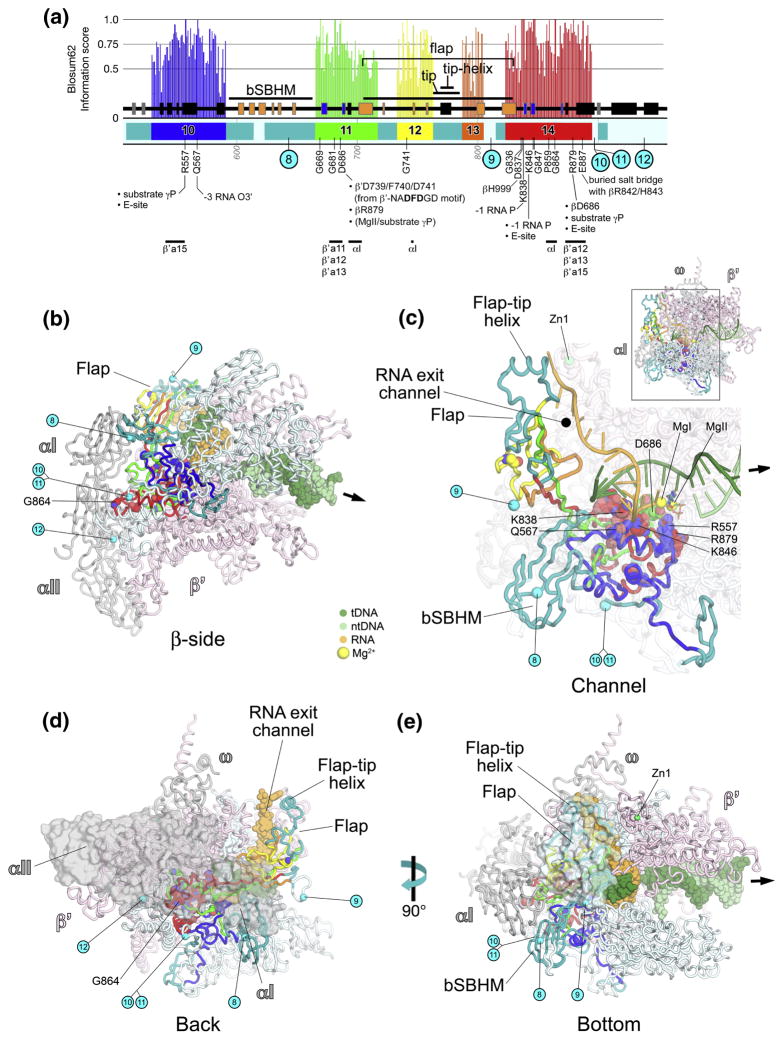
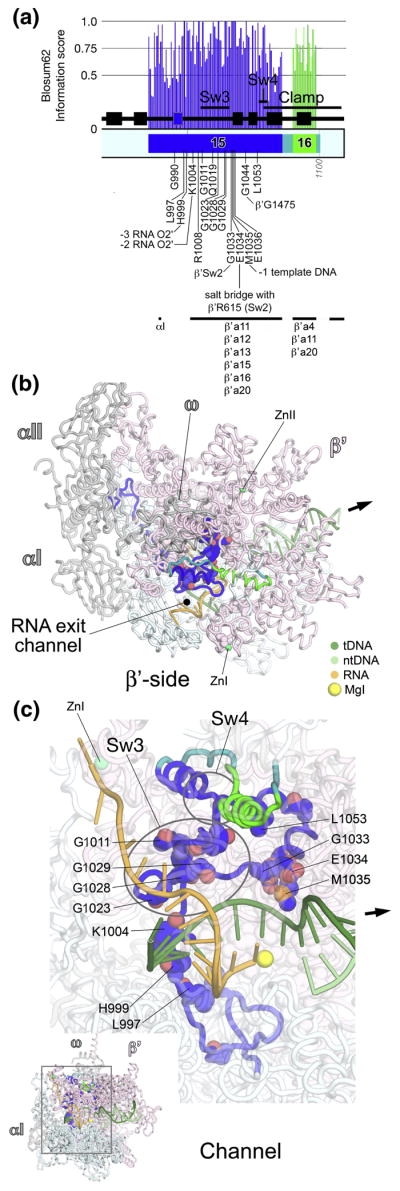
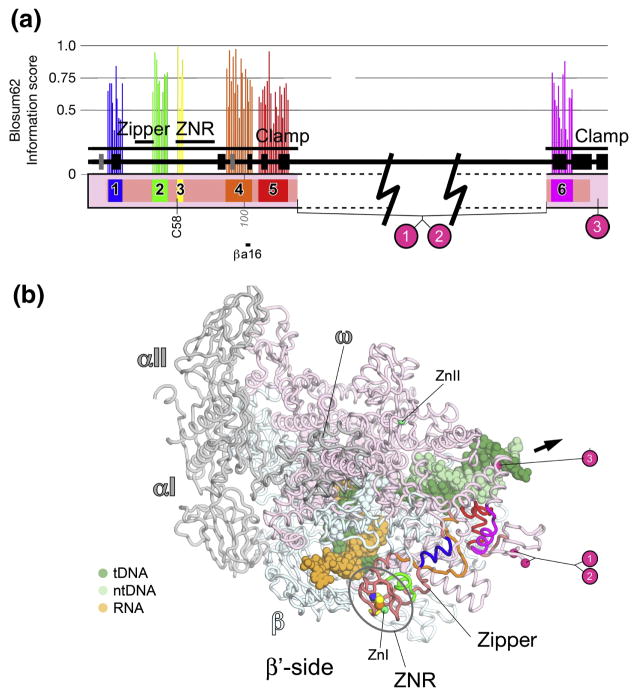
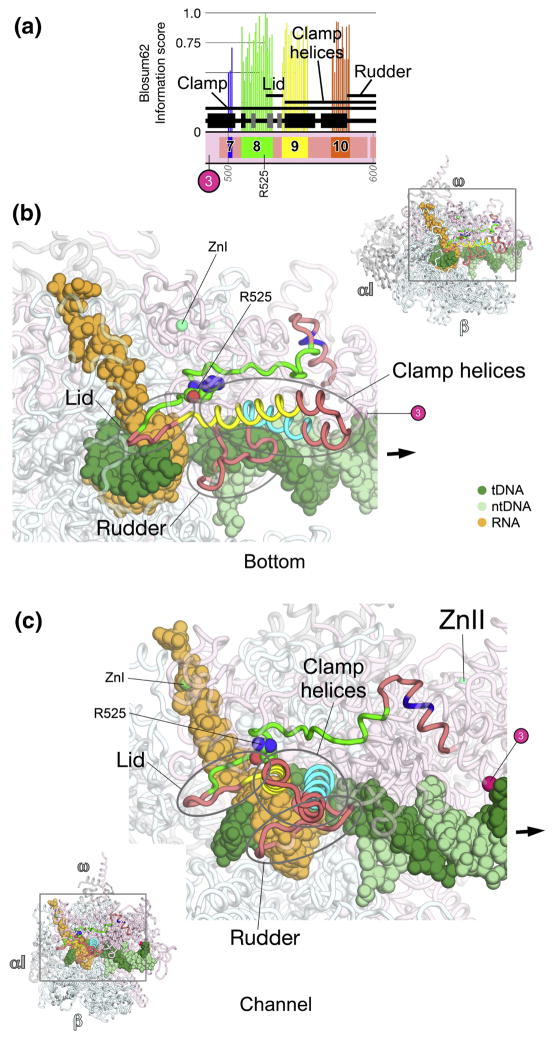
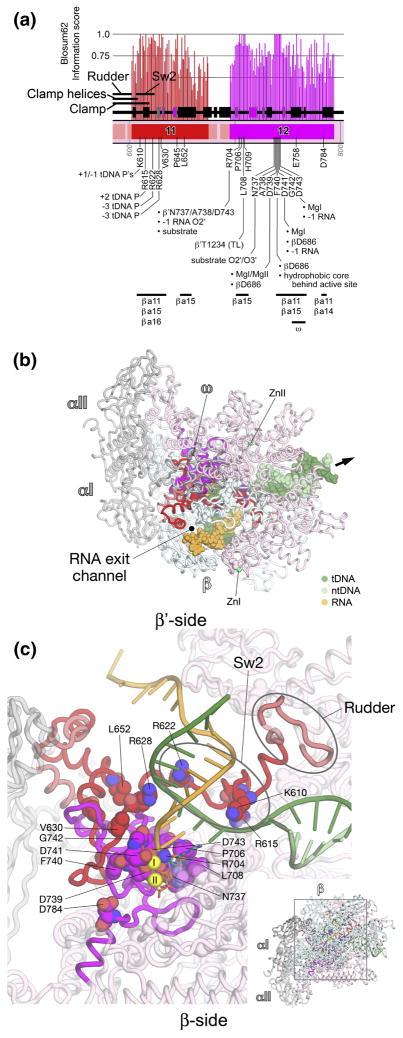
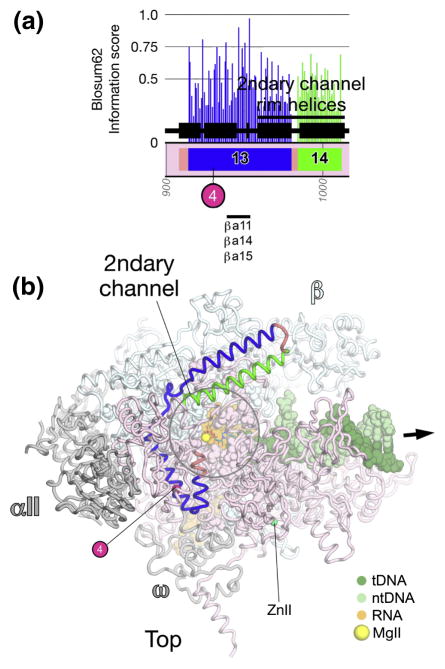
Comprehensive multiple sequence alignments of the multisubunit DNA-dependent RNA polymerase (RNAP) large subunits, including the bacterial beta and beta' subunits and their homologs from archaebacterial RNAPs, eukaryotic RNAPs I-III, nuclear-cytoplasmic large double-stranded DNA virus RNAPs, and plant plastid RNAPs, were created [Lane, W. J. and Darst, S. A. (2009). Molecular evolution of multisubunit RNA polymerases: sequence analysis. In press]. The alignments were used to delineate sequence regions shared among all classes of multisubunit RNAPs, defining common, fundamental RNAP features as well as identifying highly conserved positions. Here, we present a systematic, detailed structural analysis of these shared regions and highly conserved positions in terms of the RNAP structure, as well as the RNAP structure/function relationship, when known.


Figures

Fig. 1
Fig. 1. βa1-a7; β1 and β2 domains
A. Schematic representation of the sequence context of βa1-a7 in Thermus RNAP. Regions shared among all RNAPs are color-coded and labeled: βa1, blue; βa2, green; βa3, yellow-green;β a4, yellow; βa5, orange; βa6, red; βa7, magenta. Additional regions shared among bRNAP are colored teal. Above each region shared among all RNAPs is a histogram showing the Blosum62 information score (scale on the left) for each residue, as determined by the program PFAAT . The secondary structure is shown directly above the sequence bar (helices, black rectangles; β-strands, grey rectangles). Important structural features discussed in the text are denoted above that. Below the sequence bar, small grey numbers (vertically oriented 100, 200, etc.) denote the residue numbering of the Thermus β-subunit. The approximate insertion points of the lineage-specific insertions are denoted by cyan circles and labeled according to Lane & Darst . The position of highly conserved βGly131 (within β a4) is denoted. B. β-side view of the Tth bRNAP TEC structure (PDB 2O5J) . The RNAP is shown as a backbone worm and color-coded as follows: αI, αII, ω, grey; β′, light pink; β as in (A). The nucleic acids of the TEC are shown in CPK format and color-coded as shown in the key. Highly conserved βGly131 is shown in CPK format. The approximate insertion points for the lineage-specific insertions are denoted by cyan spheres and labeled as in (A). The thick black arrow points in the downstream direction (the direction of RNAP transcription).
Fig. 2
Fig. 2. βa7-a9; fork-loop 2
A. Schematic representation of the sequence context of βa7-a9 in Thermus RNAP. As in Fig. 1A, except: βa7, magenta; βa8, blue; βa9, green. The approximate insertion point for βIn7 is shown as a cyan circle. At the bottom, the horizontal line denotes a segment of βa8 that participates in conserved interactions with another shared region, β′a15. The positions of highly conserved residues are denoted. B–D. Views of the Tth bRNAP TEC structure (PDB 2O5J) . The RNAP is shown as a backbone worm and color-coded as follows: αI, αII, ω, grey; β′, light pink; β as in (A). The active-site MgI is shown as a yellow sphere (C, D). The nucleic acids of the TEC are color-coded as shown in the key. Highly conserved residues are shown in CPK format. The approximate insertion point for βIn7 is denoted by a cyan sphere and labeled as in (A). The thick black arrow points in the downstream direction (the direction of RNAP transcription). B. β-side view. The nucleic acids of the TEC are shown in CPK format. C. (Inset, lower-left) Channel view. The boxed region is magnified above. (Magnified view) In this view, most of β and β′ are transparent for clarity. The nucleic acids of the TEC are shown as backbone worms. D. (Inset, upper-right) Top view. The boxed region is magnified below. (Magnified view) In this view, most of β and β′ are transparent for clarity. The nucleic acids of the TEC are shown in CPK format.
Fig. 3
Fig. 3. βa10-a14; catalytic center, flap domain
A. Schematic representation of the sequence context of βa10-a14 in Thermus RNAP. As in Fig. 1A, except: βa10, blue; βa11, green; βa12, yellow; βa13, orange; βa14, red. The positions and roles of highly conserved residues are denoted. The approximate insertion points of lineage-specific insertions are denoted by cyan circles and labeled according to Lane & Darst . At the bottom, the horizontal lines denote segments that participate in conserved interactions with other shared regions. The core secondary structural elements of evolutionarily conserved domains are denoted by color-coding. The 6 β-strands of an SBHM domain shared among bRNAPs (bSBHM) are colored orange, as are the 6 β-strands of the SBHM domain comprising the base of the flap domain, which is shared among all RNAPs. The first 5 β-strands (out of 6) of the βDPBB (Double-psi β-Barrel; see Discussion and Figs. S4 and S5) are colored blue. B–E. Views of the Tth bRNAP TEC structure (PDB 2O5J) . The RNAP is shown as a backbone worm and color-coded as follows: αI, αII, ω, grey; β′, light pink; β as in (A). The nucleic acids of the TEC are color-coded as shown in the key. Zn2+ ions are shown as green spheres (C, E). Highly conserved residues are shown in CPK format. The approximate insertion points for lineage-specific insertions are denoted by cyan spheres and labeled as in (A). The thick black arrow points in the downstream direction (the direction of RNAP transcription). B. β-side view. The nucleic acids of the TEC are shown in CPK format. C. (Inset, upper-right) Channel view. The boxed region is magnified below. (Magnified view) In this view, most of β and β′ are transparent for clarity. The nucleic acids of the TEC are shown as backbone worms. The active-site MgI and MgII are shown as yellow spheres (C). The incoming nucleotide substrate is shown in stick format, with carbon atoms colored blue. D. Back view. The α subunits are shown as a molecular surface instead of a backbone worm. The nucleic acids of the TEC are shown in CPK format. E. Bottom view. The flap includes a transparent molecular surface. The nucleic acids of the TEC are shown in CPK format.
Fig. 4
Fig. 4. βa15-a16; RNA/DNA hybrid interactions, RNA exit channel, clamp
A. Schematic representation of the sequence context of βa15-a16 in Thermus RNAP. As in Fig. 1A, except: βa15, blue; βa16, green. The positions and roles of highly conserved residues are denoted. At the bottom, the horizontal lines denote segments that participate in conserved interactions with other shared regions. The 6th β-strand of the βDPBB (see Discussion and Figs. S4 and S5) is colored blue. B, C. Views of the Tth bRNAP TEC structure (PDB 2O5J) . The RNAP is shown as a backbone worm and color-coded as follows: αI, αII, ω, grey; β′, light pink; β as in (A). The nucleic acids of the TEC are color-coded as shown in the key. Zn2+ ions are shown as green spheres. Highly conserved residues are shown in CPK format. The thick black arrow points in the downstream direction (the direction of RNAP transcription). B. β′-side view. The nucleic acids of the TEC are shown as backbone worms. C. (Inset, lower-left) Channel view. The boxed region is magnified above. (Magnified view) In this view, most of β and β′ are transparent for clarity. The nucleic acids of the TEC are shown as backbone worms. The active-site MgI is shown as a yellow sphere.
Fig. 5
Fig. 5. β′a1-a6; clamp
A. Schematic representation of the sequence context of β′a5-a6 in Thermus RNAP. Regions shared among all RNAPs are color-coded and labeled: β′a1, blue; β′a2, green; β′a3, yellow; β′a4, orange; β′a5, red; β′a6, magenta. Additional regions shared among bRNAPs are colored dark pink. Above each region shared among all RNAPs is a histogram showing the Blosum62 information score (scale on the left) for each residue, as determined by the program PFAAT . The secondary structure is shown directly above the sequence bar (helices, black rectangles; β-strands, grey rectangles). Important structural features discussed in the text are denoted above that. Below the sequence bar, small grey numbers (vertically oriented 100, 200, etc.) denote the residue numbering of the Thermus β′-subunit. The approximate insertion points of the lineage-specific insertions are denoted by cyan circles and labeled according to Lane & Darst . At the bottom, the horizontal line denotes a segment of β′a4 that participates in conserved interactions with another shared region, βa16. The approximate insertion points of the lineage-specific insertions are denoted by magenta circles and labeled according to Lane & Darst . The position of highly conserved β′C58 is denoted. B. β′-side view of the Tth bRNAP TEC structure (PDB 2O5J) . The RNAP is shown as a backbone worm and color-coded as follows: αI, αII, ω, grey; β, light cyan; β′, as in (A). The nucleic acids of the TEC are shown in CPK format and color-coded as shown in the key. Zn2+ ions are shown as green spheres. Highly conserved β′Cys58 is shown in CPK format. The approximate insertion points for the lineage-specific insertions are denoted by magenta spheres and labeled as in (A). The thick black arrow points in the downstream direction (the direction of RNAP transcription).
Fig. 6
Fig. 6. β′a7-a10; clamp, lid, clamp helices
A. Schematic representation of the sequence context of β′a7-a10 in Thermus RNAP. As in Fig. 5A, except: β′a7, blue; β′a8, green; β′a9, yellow; β′a10, orange. The approximate insertion point of β′In3 is denoted by a magenta circle. The position of highly conserved β′R525 (within β′a8) is denoted. B, C. Views of the Tth bRNAP TEC structure (PDB 2O5J) . The RNAP is shown as a backbone worm and color-coded as follows: αI, αII, ω, grey; β, cyan; β′ as in (A). The nucleic acids of the TEC are color-coded as shown in the key. Zn2+ ions are shown as green spheres. The approximate insertion point for β′In3 is denoted by a magenta sphere. Highly conserved β′R525 is shown in CPK format. The thick black arrow points in the downstream direction (the direction of RNAP transcription). B. (Inset, upper-right) Bottom view. The boxed region is magnified below. (Magnified view) In this view, most of β and β′ are transparent for clarity. C. (Inset, lower-left) Channel view. The boxed region is magnified above. (Magnified view) In this view, most of β and β′ are transparent for clarity.
Fig. 7
Fig. 7. β′a11-a12; Sw2, catalytic center
A. Schematic representation of the sequence context of β′a11-a12 in Thermus RNAP. As in Fig. 5A, except: β′a11, red; β′a12, magenta. The positions and roles of highly conserved residues are denoted. At the bottom, the horizontal lines denote segments that participate in conserved interactions with other shared regions. The 6 β-strands of the β′DPBB (see Discussion and Figs. S4 and S6) are colored magenta. B, C. Views of the Tth bRNAP TEC structure (PDB 2O5J) . The RNAP is shown as a backbone worm and color-coded as follows: αI, αII, ω, grey; β, cyan; β′ as in (A). The nucleic acids of the TEC are color-coded as shown in the key. Highly conserved residues are shown in CPK format. The thick black arrow points in the downstream direction (the direction of RNAP transcription). B. β′-side view. Zn2+ ions are shown as green spheres. The nucleic acids of the TEC are shown in CPK format. C. (Inset, lower-right) β-side view. The boxed region is magnified above. (Magnified view) In this view, β is not shown, and most of β′ is transparent for clarity. MgI and MgII in the active site are shown as yellow spheres. The incoming nucleotide substrate is shown in stick format, with carbon atoms colored blue. The nucleic acids of the TEC are shown as backbone worms.
Fig. 8
Fig. 8. β′a13-a15; secondary-channel rim helices
A. Schematic representation of the sequence context of β′a13-a14 in Thermus RNAP. As in Fig. 5A, except: β′a13, blue; β′a14, green. The approximate insertion point of β′In4 is denoted by a magenta circle. At the bottom, the horizontal line denotes a segment of β′a13 that participates in conserved interactions with other shared regions. B. Top view of the Tth bRNAP TEC structure (PDB 2O5J) . The RNAP is shown as a backbone worm and color-coded as follows: αI, αII, ω, grey; β, light cyan; β′, as in (A). The nucleic acids of the TEC are shown in CPK format and color-coded as shown in the key. MgII in the active site are shown as yellow spheres. The incoming nucleotide substrate is shown in stick format, with carbon atoms colored blue. Zn2+ ions are shown as green spheres. The approximate insertion point for β′In4 is denoted by a magenta sphere and labeled as in (A). The thick black arrow points in the downstream direction (the direction of RNAP transcription).
Fig. 9
Fig. 9. β′a15-16; bridge helix, trigger-loop
A. Schematic representation of the sequence context of β′a15-a16 in Thermus RNAP. As in Fig. 5A, except: β′a15, yellow; β′a16, cyan. The positions and roles of highly conserved residues are denoted. The approximate insertion points of lineage-specific insertions are denoted by magenta circles and labeled according to Lane & Darst . At the bottom, the horizontal lines denote segments that participate in conserved interactions with other shared regions. The secondary structural elements (4 β-strands, 2 α-helices) of a BBM2 domain shared among many bRNAPs (bBBM2) are colored cyan. The ‘jaw’ domain comprises another SBHM fold that is shared among many bRNAPs. B, C. Views of the Tth bRNAP TEC structure (PDB 2O5J) . The RNAP is shown as a backbone worm and color-coded as follows: αI, αII, ω, grey; β, cyan; β′ as in (A). The nucleic acids of the TEC are shown as backbone worms and color-coded as shown in the key. Highly conserved residues are shown in CPK format. The active site MgI and MgII are shown as yellow spheres. The incoming nucleotide substrate is shown in stick format with carbon atoms colored blue. The approximate insertion points for lineage-specific insertions are denoted by magenta spheres and labeled as in (A). The thick black arrow points in the downstream direction (the direction of RNAP transcription). B. (Inset, upper-left) β-side view. The boxed region is magnified below. (Magnified view) In this view, β is not shown, and most of β′ is transparent for clarity. C. (Inset, lower-right) Channel view. The boxed region is magnified above. (Magnified view) In this view, most of β and β′ are transparent for clarity.
Fig. 10
Fig. 10. β′a17-a20; clamp, Sw5
A. Schematic representation of the sequence context of β′a17-a20 in Thermus RNAP. As in Fig. 5A, except: β′a17, red; β′a18, magenta; β′a19, blue; β′a20, green. The approximate insertion point of β′In7 is denoted by a magenta circle. At the bottom, the horizontal line denotes a segment of β′a20 that participates in conserved interactions with other shared regions. B, C. Views of the Tth bRNAP TEC structure (PDB 2O5J) . The RNAP is shown as a backbone worm and color-coded as follows: αI, αII, ω, grey; β, cyan; β′ as in (A). The nucleic acids of the TEC are shown in CPK format and color-coded as shown in the key. Highly conserved residues are shown in CPK format. Zn2+ ions are shown as green spheres. The approximate insertion point for β′In7 is denoted by a magenta sphere. The thick black arrow points in the downstream direction (the direction of RNAP transcription). B. β′-side view. C. Top view.

References

    1. Cramer P. Multisubunit RNA polymerases. Curr Opinion Struct Biol. 2002;12:89–97. - PubMed
    1. Archambault J, Friesen JD. Genetics of RNA polymerases I, II, and III. Microbiol Rev. 1993;57:703–724. - PMC - PubMed
    1. Jokerst RS, Weeks JR, Zehring WA, Greenleaf AL. Analysis of the gene encoding the largest subunit of RNA polymerase II in Drosophila. Mol Gen Genet. 1989;215:266–275. - PubMed
    1. Lane WJ, Darst SA. Molecular evolution of multi-subunit RNA polymerases: sequence analysis 2009 - PMC - PubMed
    1. Sweetser D, Nonet M, Young RA. Prokaryotic and eukaryotic RNA polymerases have homologous core subunits. Proc Natl Acad Sci USA. 1987;84:1192–1196. - PMC - PubMed

Publication types

LinkOut - more resources