. 2009 Nov 6;5(5):527-39.
doi: 10.1016/j.stem.2009.09.014.

FoxO3 regulates neural stem cell homeostasis

Affiliations

FoxO3 regulates neural stem cell homeostasis

Valérie M Renault et al. Cell Stem Cell. .

Abstract

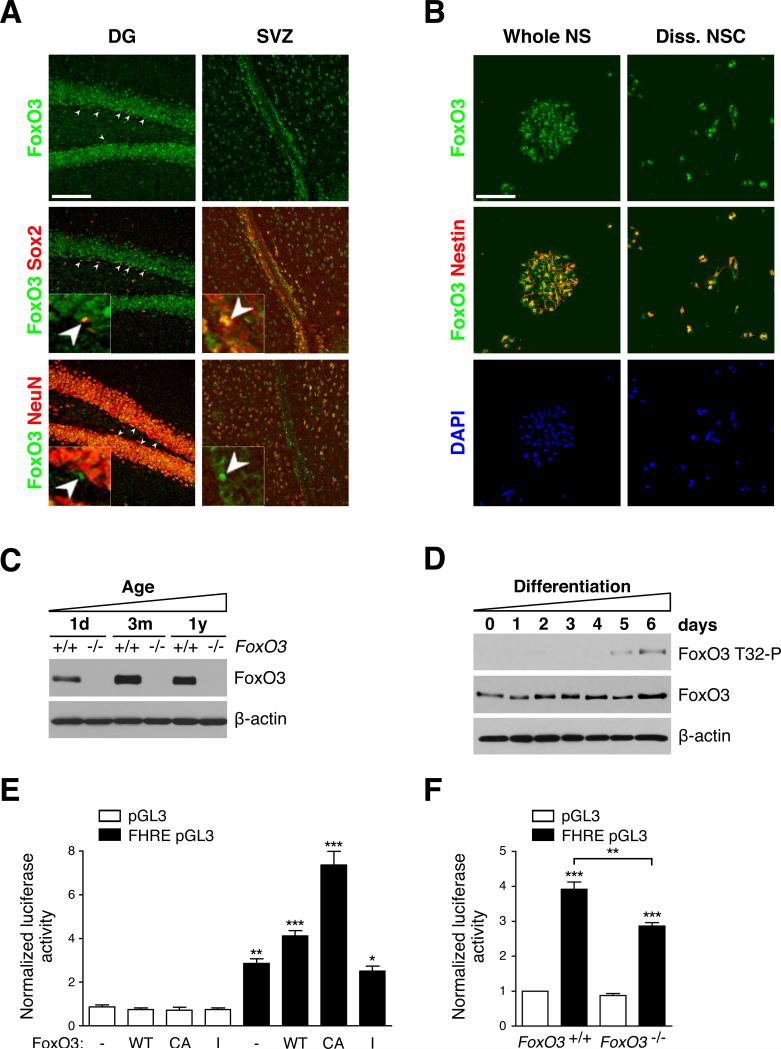
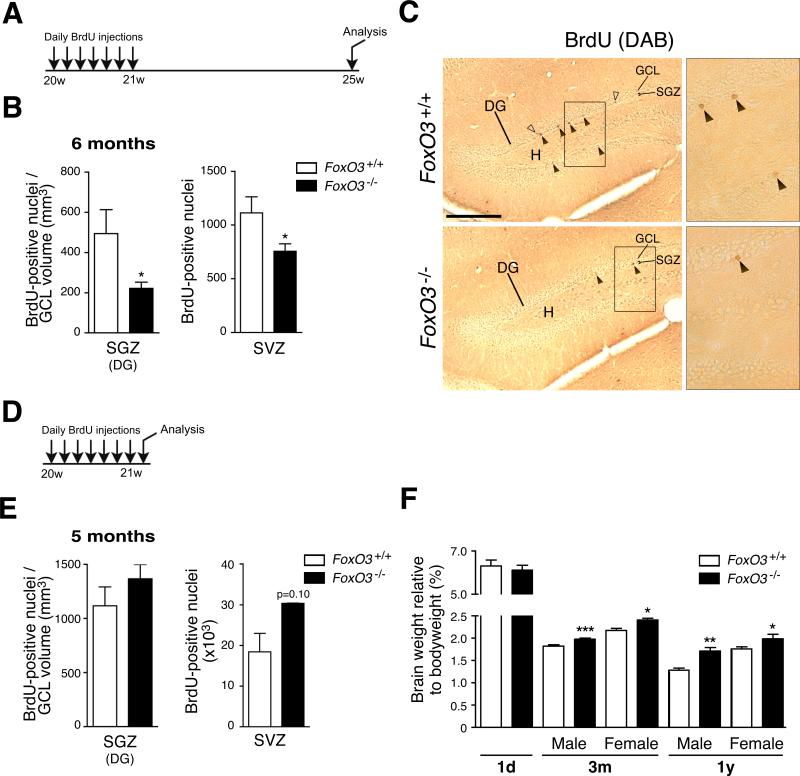
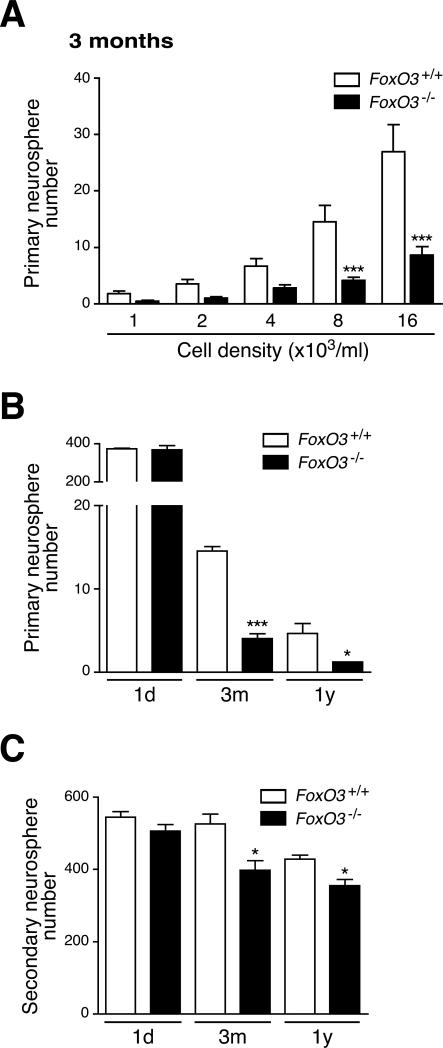
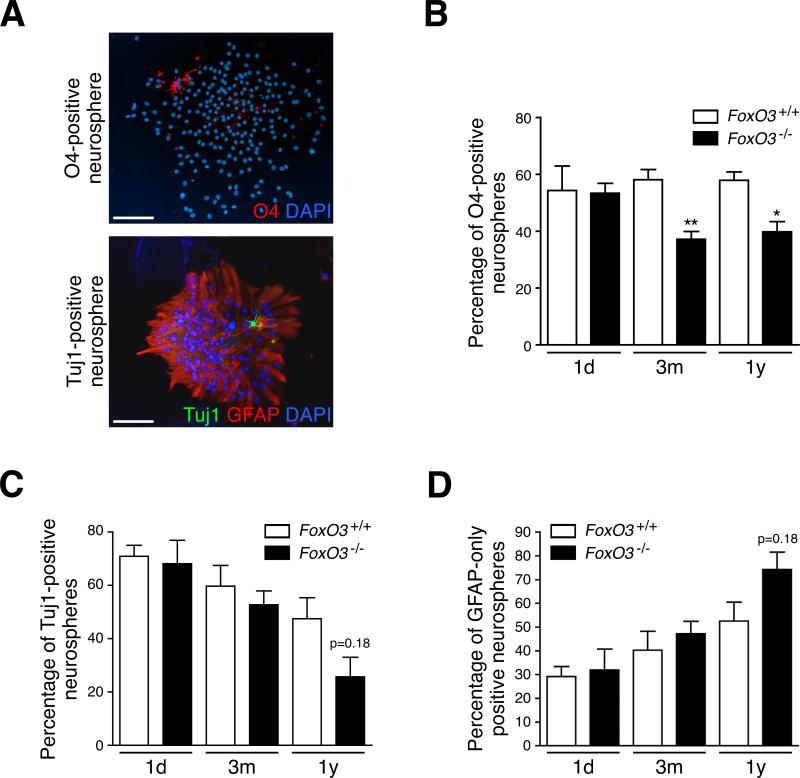
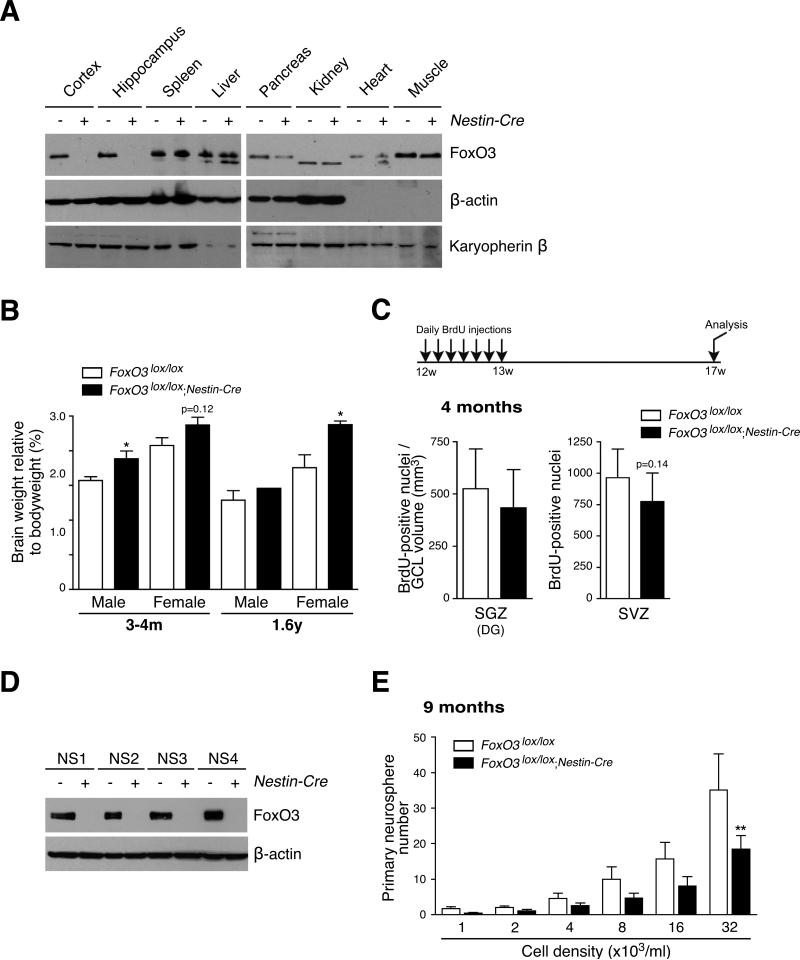
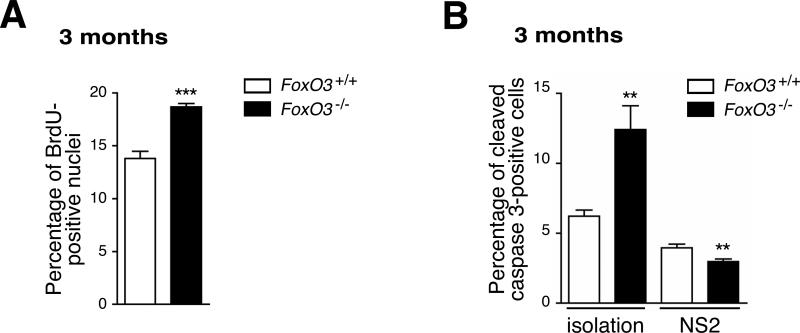
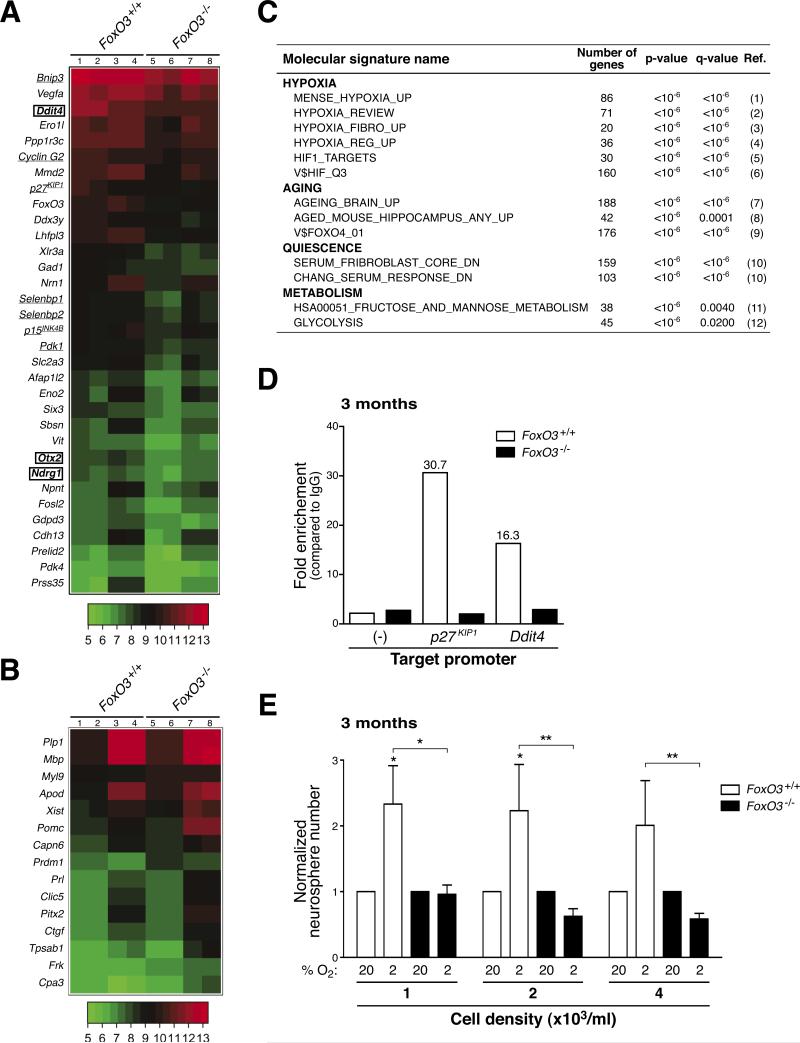
In the nervous system, neural stem cells (NSCs) are necessary for the generation of new neurons and for cognitive function. Here we show that FoxO3, a member of a transcription factor family known to extend lifespan in invertebrates, regulates the NSC pool. We find that adult FoxO3(-/-) mice have fewer NSCs in vivo than wild-type counterparts. NSCs isolated from adult FoxO3(-/-) mice have decreased self-renewal and an impaired ability to generate different neural lineages. Identification of the FoxO3-dependent gene expression profile in NSCs suggests that FoxO3 regulates the NSC pool by inducing a program of genes that preserves quiescence, prevents premature differentiation, and controls oxygen metabolism. The ability of FoxO3 to prevent the premature depletion of NSCs might have important implications for counteracting brain aging in long-lived species.


Figures

Figure 1
Figure 1. FoxO3 is expressed and active in NSC
(A) FoxO3 is expressed in adult NSC in vivo. Immunohistochemistry on brain sections of 3 month-old mice with antibodies to FoxO3 (‘Ct’), Sox2, and NeuN in the dentate gyrus (DG) of the hippocampus and in the subventricular zone (SVZ) of. Sox2-positive/FoxO3-positive and NeuN-negative/FoxO3-positive nuclei are shown by white arrowheads. Higher magnification images are included. Scale bar: 100 μm. (B) FoxO3 is expressed in purified NSC in culture. Immunocytochemistry on NSC isolated from 3 month-old mice with antibodies to FoxO3 (‘Ct’) and to Nestin. DAPI was used to stain nuclei. NSC were either grown as neurospheres (whole NS) (left panels) or freshly dissociated NSC (Diss. NSC) (right panels). Scale bar: 100 μm. (C) FoxO3 expression in NSC at different ages. Western blots of protein lysates from secondary neurospheres in self-renewing conditions from FoxO3+/+ and FoxO3−/− littermates at 3 different ages, 1 day-old (1d), 3 month-old (3m), and 1 year-old (1y), probed with antibodies to FoxO3 (‘NFL’) and to β-actin. The data presented are representative of 3 independent experiments. (D) FoxO3 phosphorylation is increased in differentiated progeny. Western blots of protein lysates of dissociated wild-type adult NSC in self-renewing conditions (day 0) or in differentiation conditions for increasing lengths of time (days 1-6) (Figure S3A). Western blots were probed with antibodies to FoxO3 (‘NFL’), to Phospho-T32 (FoxO3 T32-P) and to β-actin. Blots representative of 3 independent experiments. (E) A FoxO-dependent reporter gene is responsive to FoxO3 in NSC. Luciferase assays in wild-type adult NSC using a promoter containing three FoxO binding sites driving the luciferase reporter gene (FHRE pGL3) or a control promoter (pGL3) and FoxO3 expression vectors (-: empty vector; WT: wild-type; CA: constitutively active; I: inactive). Values represent mean ± SEM from 3 independent experiments. One-way ANOVA, Bonferroni post-tests, *: p<0.05, **: p<0.01, ***: p<0.001. (F) Endogenous FoxO3 is active in self-renewing NSC. Luciferase assays in FoxO3+/+ and FoxO3−/− adult NSC using FHRE pGL3 or control pGL3 as in E. Values were normalized to the first column. Values represent mean ± SEM from 3 independent experiments. One-way ANOVA, Bonferroni post-tests, **: p<0.01, ***: p<0.001.
Figure 2
Figure 2. The ablation of FoxO3 results in a decrease in NSC number in vivo
(A) Experimental design for the quantification of NSC in vivo. 5 month-old FoxO3+/+ and FoxO3−/− littermates were injected daily with BrdU for 7 days and sacrificed one month after the last BrdU injection. (B) Quantification of label-retaining NSC in vivo. Number of BrdU-positive cells one month after 7 days of daily BrdU injection in SGZ of the DG (left panel) and the SVZ (right panel, Figure S4A). The number of BrdU-positive cells in the SGZ was normalized to the volume of the granular cell layer (GCL) (Figure S4C). Values represent mean ± SEM (left panel) and mean ± SD (right panel) from 5 animals for FoxO3+/+ and 4 animals for FoxO3−/− mice. Mann-Whitney test, *: p<0.05. (C) Examples of label-retaining NSC in the DG of FoxO3+/+ and FoxO3−/− mice. Coronal sections of adult FoxO3+/+ and FoxO3−/− mouse brains showing BrdU-positive nuclei one month after 7 days of daily BrdU injection in the SGZ. Filled arrowhead: label-retaining NSC. Empty arrowhead: BrdU-positive cells that have migrated into the GCL. DG: dentate gyrus, H: hilus. Scale bar: 200 μm. Right panels represent higher magnifications of the rectangles in the left panels. (D) Experimental design for the quantification of proliferating NSC and neural progenitors in vivo. 5 month-old FoxO3+/+ and FoxO3−/− littermates were injected daily with BrdU for 7 days and sacrificed one day after the last BrdU injection. (E) Quantification of proliferating NSC and neural progenitors in vivo. Number of BrdU-positive cells one day after 7 days of daily BrdU injections in the SGZ (left panel) and the SVZ (right panel). The number of BrdU-positive cells in the SGZ was normalized to the GCL volume (Figure S4D). Values represent mean ± SEM (left panel) and mean ± SD (right panel) from 3 animals for each genotype. Mann-Whitney test, p=0.40 (left panel) and p=0.10 (right panel). (F) Brain weight is increased in adult FoxO3−/− mice compared to FoxO3+/+ littermates. Brain weights were measured for FoxO3−/− and FoxO3+/+ animals in mice at different ages (1 day-old (1d), 3 month-old (3m), and 1 year-old (1y)). Values represent mean ± SEM from 4-6 mice (1d), 20-23 males and 6-9 females (3m), and 4-7 males and females (1y). Mann-Whitney test, *: p<0.05; **: p<0.01; ***: p<0.001.
Figure 3
Figure 3. FoxO3 regulates the NSC pool and NSC self-renewal in adult mice, but not in neonates
(A) FoxO3−/− NSC from adult mice display a defect in primary neurosphere formation. NSC isolated from 3 month-old FoxO3+/+ or FoxO3−/− littermates were seeded at the indicated cell densities. The number of neurospheres formed after one week was counted. Values represent mean ± SEM from 7 independent experiments performed with 5 littermates for each genotype. Two-way ANOVA (p<0.0001 for the genotype variable), Bonferroni post-tests, ***: p<0.001. (B) FoxO3−/− NSC from adult mice, but not from neonates, display a defect in primary neurosphere formation. Frequency of primary neurospheres formed from NSC at low-density (8,000 cells/ml) from mice at different ages (1 day-old, 1d; 3 month-old (3m); 1 year-old (1y)). Values represent mean ± SEM from 2 independent experiments with 2 littermates (1d), 7 independent experiments with 5 littermates (3m), and 3 independent experiments with 3-5 littermates (1y) for each genotype. Two-way ANOVA with Bonferroni post-tests, *: p<0.05; ***: p<0.001. (C) FoxO3−/− NSC from adult mice, but not from neonates, display a defect in secondary neurosphere formation. Dissociated cells from primary neurospheres from FoxO3+/+ or FoxO3−/− littermates were seeded at 4,000 cells/ml. The number of secondary neurospheres formed after one week was counted. Values represent mean ± SEM from 2 independent experiments with 2 littermates (1d), 4 independent experiments with 5 littermates (3m), and 4 independent experiments with 3 to 5 littermates for each genotype (1y) for each genotype. Two-way ANOVA with Bonferroni post-tests, *: p<0.05.
Figure 4
Figure 4. FoxO3 controls the ability of adult NSC to give rise to different lineages
(A) Adult NSC give rise to at least bipotent neurospheres. Astrocytes, neurons, and oligodendrocytes present in whole neurospheres after 7 days of differentiation were stained with antibodies to GFAP, Tuj1, and O4 respectively. Scale bars: 100 μm. (B) FoxO3−/− NSC from adult mice, but not from neonates, give rise to fewer oligodendrocyte-containing neurospheres than FoxO3+/+ NSC. FoxO3+/+ and FoxO3−/− NSC from mice at different ages (1 day-old, 1d; 3 month-old, 3m; 1 year-old, 1y) were grown as secondary neurospheres at low density. The neurospheres were differentiated for a week and stained with antibodies to O4. Neurospheres that contained oligodendrocytes were counted. Values represent mean ± SEM from 2 independent experiments with 2 littermates (1d), 5 littermates (3m), and 3-5 littermates (1y) for each genotype. Student's t-test, *: p<0.05; **: p<0.01. (C-D) FoxO3−/− NSC from middle-aged mice tend to give rise to fewer neuron-containing neurospheres than FoxO3+/+ NSC. Neurospheres were grown as described in B and stained with antibodies to Tuj1 and GFAP. Neurospheres that contained neurons and astrocytes were counted. Values represent mean ± SEM from 2 independent experiments with 2 littermates (1d), 5 littermates (3m) and 3-5 littermates (1y) for each genotype. Student's t-test, p=0.18. (C) Neurospheres containing at least one Tuj-1 positive cell; (D) Neurospheres containing only GFAP-positive cells.
Figure 5
Figure 5. Consequences of FoxO3 loss in the nervous system on brain weight and the NSC pool
(A) Expression of FoxO3 in the tissues of FoxO3lox/lox;Nestin-Cre mice. FoxO3 expression in different tissues of 2 month-old FoxO3lox/lox;Nestin-Cre mice was determined by Western blot with antibodies to FoxO3 (‘NFL’) and antibodies to β-actin and karyopherin β. Note that FoxO3 was partially deleted in the pancreas. (B) Brain weights of FoxO3lox/lox;Nestin-Cre and FoxO3lox/lox mice. Brain weights were measured after perfusion in 3 to 4 month-old mice (3-4m) and 1.6 year-old mice (1.6y). Values represent mean ± SEM from 9-10 males and 9-10 females (3-4m), and 1-3 males and 5-8 females (1.6y). One male and 2 females (3-4m) and 3 females (1.6y) of the FoxO3lox/+ genotype were included in the control group (FoxO3lox/lox). (C) Quantification of label-retaining NSC in FoxO3lox/lox;Nestin-Cre and FoxO3lox/lox animals in vivo. Number of BrdU-positive cells in the SGZ (left panel) and the SVZ (right panel) in 3 month-old FoxO3lox/lox;Nestin-Cre and FoxO3lox/lox littermates injected daily with BrdU for 7 days and sacrificed one month after the last BrdU injection. The number of BrdU-positive cells in the SGZ was normalized to the volume of the granular cell layer (GCL). Values represent mean ± SEM (left panel) and mean ± SD (right panel) from 8 FoxO3lox/lox;Nestin-Cre mice and 11 FoxO3lox/lox control littermates. Two FoxO3lox/+ littermates were included in the control group (FoxO3lox/lox). Mann-Whitney test, p=0.27 (left panel) and p=0.14 (right panel). (D) Ablation of the FoxO3 protein in NSC from FoxO3lox/lox;Nestin-Cre mice. FoxO3 expression in NSC isolated from 3 month-old FoxO3lox/lox mice (−) or FoxO3lox/lox;Nestin-Cre mice (+) seven days after isolation (NS1) or at 3 consecutive passages (NS2 to 4) was determined by Western blot with antibodies to FoxO3 (‘NFL’) and antibodies to β-actin. (E) Ablation of FoxO3 in the brain impairs primary neurosphere formation. NSC isolated from 9 month-old FoxO3lox/lox mice (control) or FoxO3lox/lox;Nestin-Cre mice were seeded at low density. The number of neurospheres formed after one week was counted. Values represent mean ± SEM from triplicates from 4 independent experiments conducted with 3 littermates for each genotype. Twoway ANOVA, p<0.01 for the genotype variable, Bonferroni post-tests, **: p<0.01.
Figure 6
Figure 6. FoxO3 is necessary for maintaining NSC/neural progenitor quiescence
(A) Increased cell proliferation in FoxO3−/− neurospheres. Cells dissociated from secondary neurospheres from 3 month-old FoxO3+/+ or FoxO3−/− mice were plated on poly-D-lysine and incubated for 1 hour with BrdU. Cells were immunostained with antibodies to BrdU. BrdU-positive nuclei were counted. Values represent mean ± SEM from 2 independent experiments with 5 littermates for each genotype. Student's t-test, ***: p<0.001. (B) Apoptosis in FoxO3−/− NSC compared to FoxO3+/+ NSC. Freshly isolated NSC or cells dissociated from secondary neurospheres isolated from 3 month-old FoxO3+/+ or FoxO3−/− mice were stained with antibodies to cleaved caspase 3. Cleaved caspase 3-positive cells were counted. Values represent mean ± SEM from 2 independent experiments with 5 littermates for each genotype. Student's t-test, **: p<0.01.
Figure 7
Figure 7. FoxO3 is necessary for the expression of a program of genes that coordinately regulates NSC homeostasis
(A-B) Differentially regulated genes in FoxO3−/− NSC compared to FoxO3+/+ NSC. Whole genome microarray data obtained from two independent biological replicates of RNA from duplicates of FoxO3−/− and FoxO3+/+ secondary neurospheres isolated from 3 month-old mice (5 littermates for each genotype). Heat-map of selected genes down-regulated (A) and up-regulated (B) more than 1.5 fold in FoxO3−/− NSC compared to FoxO3+/+ NSC with a false discovery rate less than 5%. Lanes 1-2 and 5-6: duplicates from one experiment. Lanes 3-4 and 7-8: duplicates from a second independent experiment. Underlined: known FoxO target genes. Surrounded by a square: genes containing FoxO binding motifs in their regulatory regions (Table S1). (C) FoxO3-regulated genes in NSC are involved in quiescence, hypoxia, aging, and glucose metabolism. Selected publicly available molecular signatures highly enriched for genes down-regulated in FoxO3−/− NSC as provided by GSEA (Gene Set Enrichment Analysis). References (Ref.) - are included in Supplemental Data. (D) FoxO3 is recruited to the promoters of p27KIP1 and Ddit4 in NSC. ChIP of FoxO3 from NSC isolated from 3 month-old mice shows significant recruitment of FoxO3 at the promoters of p27KIP1 and Ddit4. FoxO3 recruitment was not found at control regions that did not have FoxO binding sites (−) and did not occur in FoxO3−/− neurospheres. Depicted is a representative ChIP analysis. Similar results were obtained in independent experiments (Figure S10C). (E) FoxO3−/− NSC form fewer neurospheres than FoxO3+/+ NSC in low oxygen conditions. Normalized frequency of neurospheres formed from NSC at low-density in 20% oxygen (20) or in 2% oxygen (2). NSC were dissociated from secondary neurospheres generated from 3 month-old FoxO3−/− and FoxO3+/+ mice. Values represent mean ± SEM from 4 independent experiments with 3-5 littermates for each genotype. The normalization was done by dividing the triplicate average from each experiment in 2% oxygen by the triplicate average from the same experiment in 20% oxygen. Two-way ANOVA, Bonferroni post-tests, *: p<0.05; **: p<0.01.

Comment in

References

    1. Accili D, Arden KC. FoxOs at the crossroads of cellular metabolism, differentiation, and transformation. Cell. 2004;117:421–426. - PubMed
    1. Alvarez-Buylla A, Temple S. Stem cells in the developing and adult nervous system. J Neurobiol. 1998;36:105–110. - PubMed
    1. Bakker WJ, Harris IS, Mak TW. FOXO3a is activated in response to hypoxic stress and inhibits HIF1-induced apoptosis via regulation of CITED2. Mol Cell. 2007;28:941–953. - PubMed
    1. Bondolfi L, Ermini F, Long JM, Ingram DK, Jucker M. Impact of age and caloric restriction on neurogenesis in the dentate gyrus of C57BL/6 mice. Neurobiol Aging. 2004;25:333–340. - PubMed
    1. Brunet A, Bonni A, Zigmond MJ, Lin MZ, Juo P, Hu LS, Anderson MJ, Arden KC, Blenis J, Greenberg ME. Akt promotes cell survival by phosphorylating and inhibiting a Forkhead transcription factor. Cell. 1999;96:857–868. - PubMed

Publication types

Associated data