. 2010 Jan 8;285(2):1296-310.
doi: 10.1074/jbc.M109.055863. Epub 2009 Nov 6.

Integration of a phosphatase cascade with the mitogen-activated protein kinase pathway provides for a novel signal processing function

Affiliations

Integration of a phosphatase cascade with the mitogen-activated protein kinase pathway provides for a novel signal processing function

Virendra K Chaudhri et al. J Biol Chem. .

Abstract

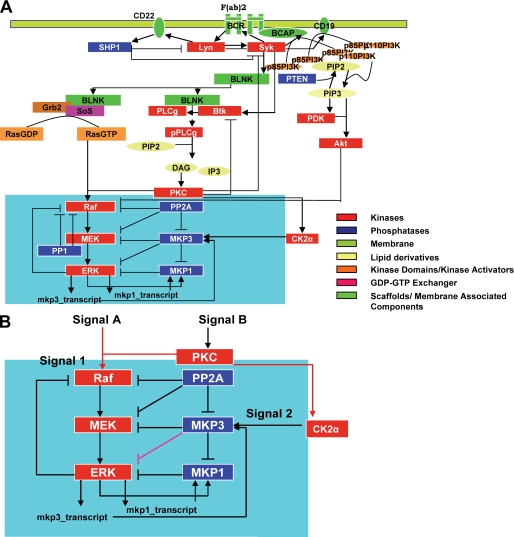
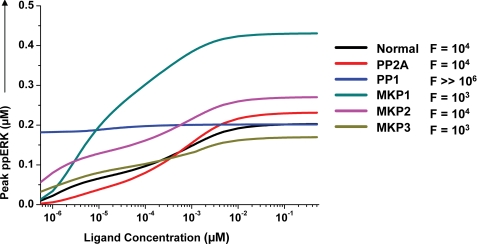
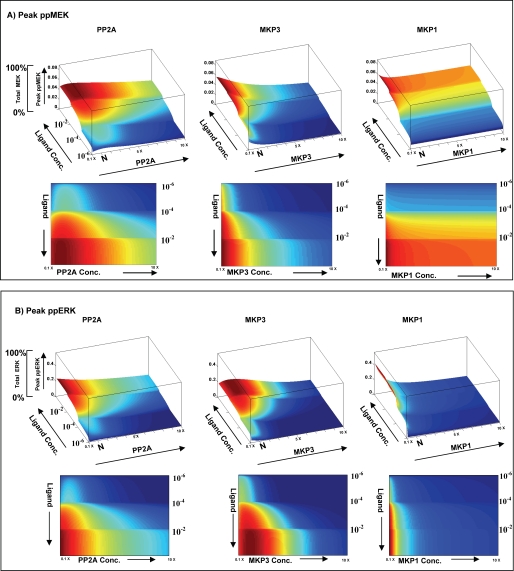
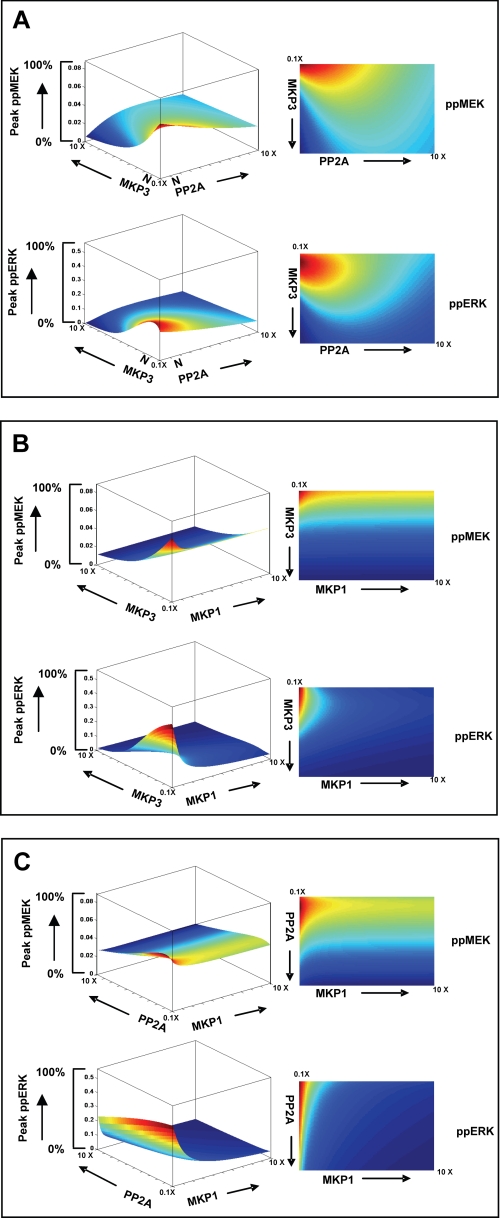
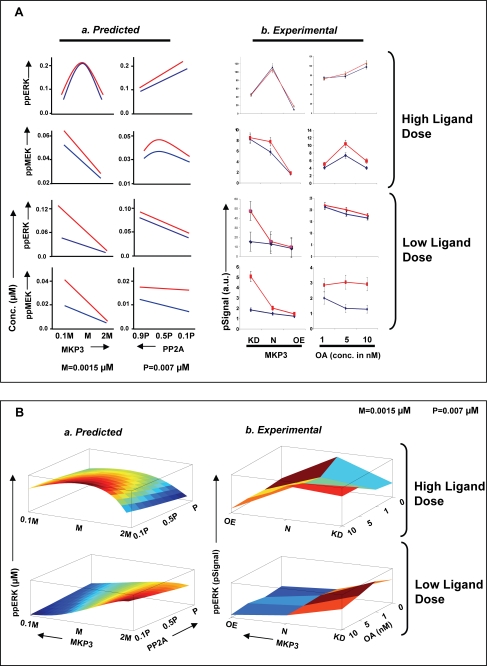
We mathematically modeled the receptor-dependent mitogen-activated protein kinase (MAPK) signaling by incorporating the regulation through cellular phosphatases. Activation induced the alignment of a phosphatase cascade in parallel with the MAPK pathway. A novel regulatory motif was, thus, generated, providing for the combinatorial control of each MAPK intermediate. This ensured a non-linear mode of signal transmission with the output being shaped by the balance between the strength of input signal and the activity gradient along the phosphatase axis. Shifts in this balance yielded modulations in topology of the motif, thereby expanding the repertoire of output responses. Thus, we identify an added dimension to signal processing wherein the output response to an external stimulus is additionally filtered through indicators that define the phenotypic status of the cell.


Figures

FIGURE 1.
FIGURE 1.
Signaling through the Lymphocyte receptor induces a novel regulatory motif for MAP kinase activation. A schematic overview of the reactions for BCR dependent activation of MAP kinase ERK1/2 is shown in panel A. The highlighted area represents the novel signaling motif identified and this is expanded in panel B. IP3, phosphatidylinositol 1,4,5-trisphosphate; PIP2, phosphatidylinositol 2; PI3K, phosphatidylinositol 3-kinase; DAG, diacylglycerol; PKC, protein kinase C; BLNK, B cell linker protein; BCAP, B cell adaptor protein.
FIGURE 2.
FIGURE 2.
The ERK phosphorylation response is proportional to the stimulus strength. Panel A shows the concordance obtained between experiment (red diamonds, values are the mean ± S.D., n = 3) and simulation (black line) examining the time course of ERK phosphorylation obtained upon stimulation of A20 cells with a saturating (25 μg/ml) concentration of anti-IgG. Panel B shows the results of an in silico analysis estimating the magnitude of ERK phosphorylation (ppERK) obtained after stimulation of cells with varying anti-IgG concentrations. Panel C gives the corresponding results of an experiment where A20 cells were stimulated for 10 min, with the indicated doses of anti-IgG. ERK phosphorylation was then determined in lysates by Western blot analysis (see supplemental Fig. S4). Values are the mean (±S.D.) of three independent experiments and are shown here as normalized raw signal intensity (pSignal intensity). A semi-log plot of these results yielded a Hill coefficient of 0.6 and 0.56 for simulated and the experimental results, respectively. Stimulated cells were also subjected to staining for intracellular phospho-ERK using antibodies specific for double-phosphorylated ERK followed by fluorescein isothiocyanate-labeled secondary antibodies. Stained cells were then analyzed by flow cytometry, and the results are shown in panel D. Depicted here are the profiles obtained for cells stimulated with either 0.1 (black line), 0.5 (green line), 5 (pink line), or 25 μg/ml (blue line) of anti-IgG. The profile for unstimulated cells overlapped with that for cells stimulated with 0.1 μg/ml of ligand. For the negative control, cells were stained with rabbit IgG instead of the anti-phospho-ERK antibody.
FIGURE 3.
FIGURE 3.
Verification of novel interactions incorporated in the model. In panel A, lysates from stimulated or unstimulated A20 cells were immunoprecipitated with antibodies specific either for MKP3, MEK, or MKP1 (“Experimental Procedures”) (left column, IP). Immunoprecipitates were then subjected to a Western blot analysis using the antibodies indicated in the right column (WB). As a negative control (ctrl), parallel immunoprecipitates with rabbit IgG were also probed with the corresponding antibodies. Panel B shows the results of Western blot analyses for MKP1 in A20 cells treated either with MKP3-specific siRNA (red line) or with non-silencing (i.e. GFP-specific) siRNA (blue line). Stimulation times with anti-IgG (25 μg/ml) are indicated, and values are the mean ± S.D. of three separate experiments. We have previously demonstrated that siRNA-mediated silencing of MKP3 results in a >70% reduction of this phosphatase protein in A20 cells (22). In C, the left panel shows the profiles obtained from an in silico analysis in the presence (pink) and absence (blue) of DRB. The right panel shows the corresponding results obtained experimentally, where cells were treated with or without DRB (20 μm) before stimulation with anti-IgG. ppERK, ERK phosphorylation.
FIGURE 4.
FIGURE 4.
Verifying the MKP3 substrate bias in response to CK2 inhibition. For the experiment, A20 cells were stimulated for 10 min with anti-IgG in the presence or absence of casein kinase inhibitor DRB (20 μm). Cells were then fixed and stained for ERK1/2 and MKP3 (top panel), MEK1/2 and MKP3 (middle panel), or MKP1 and MKP3 (bottom panel) and observed under laser scanning confocal microscope (“Experimental Procedures”). Merged images for co-localization between green (ERK1/2, MEK1/2, or MKP1) and red (MKP3) are shown in the figure. The quantitative differences between DRB-treated and -untreated cells for co-localization with MKP3-MEK1/2, MKP3-ERK1/2, and MKP3-MKP1 upon anti-IgG treatment are shown on the right-hand side. Values are the average (±S.E.) of more than at least 40 cells (***, p < 0.0005; **, p < 0.005).
FIGURE 5.
FIGURE 5.
Phosphatase-mediated regulation of the MAPK signaling response. The influence of individual phosphatases in sensitizing the ERK output was monitored in silico by analyzing ligand dose versus peak phospho-ERK (ppERK) levels within the first 30 min of activation. This analysis was performed either in normal cells (Normal) or in cells where the indicated phosphatase was depleted from the system. In each case, the -fold change in ligand concentration required to increase ERK phosphorylation from 10 to 90% of its maximal value is also given (F). These values confirm that the ERK response remains proportional under all of these conditions.
FIGURE 6.
FIGURE 6.
Modulation in phosphatase concentrations further shape ligand sensitivity of the MAPK pathway. Peak phosphorylation of ERK (ppERK) and MEK (ppMEK) was monitored in response to variations in both ligand and individual phosphatase concentrations. Three separate sets of simulation within a defined concentration window were used to reduce the computing time. For each phosphatase, 100 different concentrations of phosphatase were used varying from 10× lower to 10× higher (PP2A, 0.0007–0.07 μm; MKP3, 0.00015–0.015 μm; MKP1, 0.00002–0.002 μm) than its constituent concentration level in A20 cells. The combined data are plotted here. Panel A profiles peak phospho-MEK levels as a combined function of both varying ligand doses and varying concentrations of each of the three phosphatases. Here, the top panel shows the three-dimensional plot, whereas the lower panel depicts the same results in the form of a heat map. Similarly, panel B shows peak phospho-ERK levels as a combined function of both ligand dose and varying concentrations of the three phosphatases.
FIGURE 7.
FIGURE 7.
Inter-phosphatase cross-talk regulates signal transmission through the MAPK pathway. The effects of simultaneous variations in the concentration SAM-associated phosphatases on peak phospho-MEK (ppMEK) and peak phospho-ERK (ppERK) levels within a 30-min activation window are shown here. A total of 100 different concentrations were employed for each phosphatase. These varied from 10× lower to 10× higher than the constituent concentration in A20 cells (PP2A, 0.0007–0.07 μm; MKP3, 0.00015–0.015 μm; MKP1, 0.00002–0.002 μm). The three combinations shown here are MKP3-PP2A (A), MKP3-MKP1 (B), and PP2A-MKP1 (C). In each case the top panel shows peak phospho-MEK levels, whereas the lower panel shows peak phospho-ERK responses. The left and the right panels depict the three-dimensional landscape and the corresponding heat map representation, respectively. The corresponding profiles for the remaining components of the module that are also regulated by phosphorylation (i.e. Raf, MKP1, and MKP3) are shown in supplemental Fig. S9.
FIGURE 8.
FIGURE 8.
Experimental confirmation of the systems properties of the MAPK-associated regulatory module. Panel A depicts peak MEK and ERK phosphorylation (10 min of stimulation with anti-IgG) levels obtained as a function of changes either in MKP3 or PP2A concentrations as described in the text. For the profiles obtained in silico (Predicted), the concentration ranges utilized is described in supplemental Fig. S8, whereas the extent of variation in phosphatase concentration/activity obtained experimentally (Experimental) is described under “Experimental Support for Signal Processing Function of Phosphatase Cascade.” The anti-IgG concentrations employed for the experiment in high ligand dose (upper panel) were 10 (blue line) and 25 (red line) μg/ml, whereas for low ligand dose (lower panel), it was 0.05 (blue line) and 0.5 (red line) μg/ml. OA, okadaic acid. Panel B describes the effects of combined variations in levels/activities of both MKP3 and PP2A on the magnitude of ERK phosphorylation. Here again, a comparison between the in silico (Predicted) and the experimentally (Experimental) obtained results is shown. Although a similarity in profiles between the two groups is clearly evident, the absence of a higher degree of concordance was primarily due to the limited number of data points in the experimental group. As described in the text, MKP3 levels were varied in the experimental sets either through specific depletion by siRNA (KD) or by overexpression (OE).

References

    1. Cobb M. H. (1999) Prog. Biophys. Mol. Biol. 71, 479–500 - PubMed
    1. Widmann C., Gibson S., Jarpe M. B., Johnson G. L. (1999) Physiol. Rev. 79, 143–180 - PubMed
    1. Chang L., Karin M. (2001) Nature 410, 37–40 - PubMed
    1. Tan P. B., Kim S. K. (1999) Trends Genet 15, 145–149 - PubMed
    1. Ebisuya M., Kondoh K., Nishida E. (2005) J. Cell Sci. 118, 2997–3002 - PubMed

Publication types

Substances

LinkOut - more resources