. 2010 Jan 15;285(3):1861-9.
doi: 10.1074/jbc.M109.066167. Epub 2009 Nov 6.

Aminoquinoline surfen inhibits the action of SEVI (semen-derived enhancer of viral infection)

Affiliations

Aminoquinoline surfen inhibits the action of SEVI (semen-derived enhancer of viral infection)

Nadia R Roan et al. J Biol Chem. .

Abstract

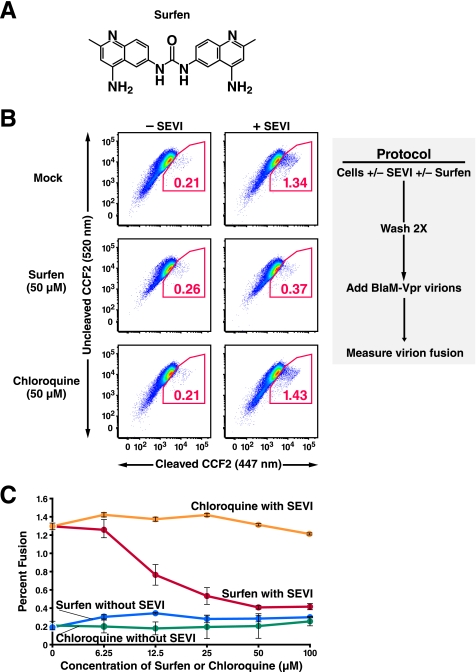
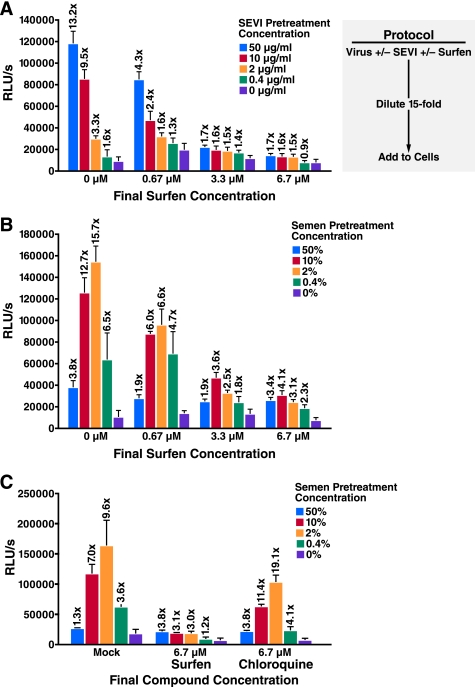
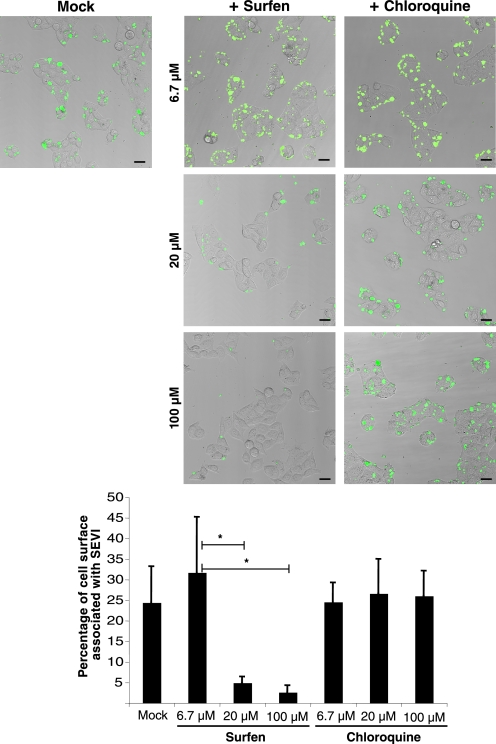
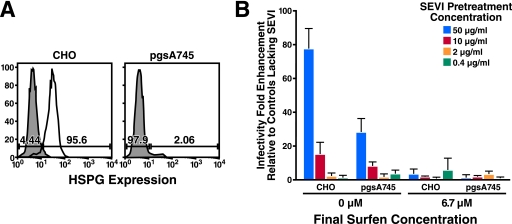
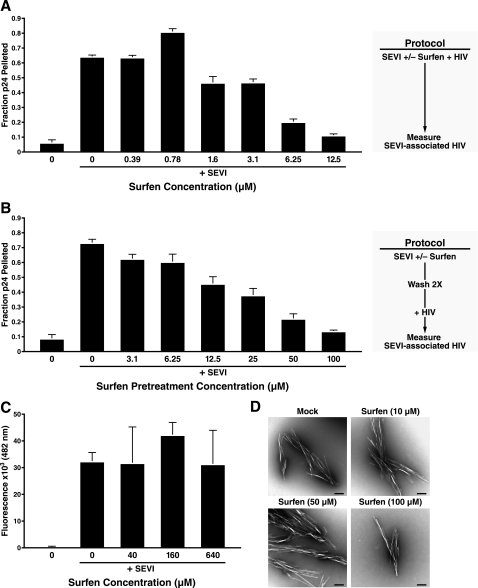
In semen, proteolytic peptide fragments from prostatic acid phosphatase can form amyloid fibrils termed SEVI (semen-derived enhancer of viral infection). These fibrils greatly enhance human immunodeficiency virus (HIV) infectivity by increasing the attachment of virions to target cells. Therefore, SEVI may have a significant impact on whether HIV is successfully transmitted during sexual contact. Here, we demonstrate that surfen, a small molecule heparan sulfate proteoglycan antagonist, inhibits both SEVI- and semen-mediated enhancement of HIV type 1 infection. Surfen interferes with the binding of SEVI to both target cells and HIV type 1 virions but does not deaggregate SEVI fibrils. Because SEVI can increase HIV infectivity by several orders of magnitude, supplementing current HIV microbicide candidates with SEVI inhibitors, such as surfen, might greatly increase their potency.


Figures

FIGURE 1.
FIGURE 1.
Surfen blocks SEVI-mediated enhancement of HIV-1 fusion to primary CD4+ T cells. A, structure of surfen. B, effect of surfen and chloroquine on HIV-1 fusion to CD14CD4+ T cells. Target cells were treated with 31.25 μg/ml SEVI in the presence of DMSO or 50 μm surfen or chloroquine as indicated. Cells were then washed twice before infection with BlaM-Vpr-containing 81A virions (200 ng/ml p24Gag), and fusion was assessed 4 h later. Values within the plots reflect the percentages of cells that fused with virions. Results are gated on CD3+CD4+ cells. These data are representative of three independent experiments performed with cells from three different donors. C, dose-response curves of surfen and chloroquine on SEVI-mediated enhancement of HIV-1 fusion to CD14CD4+ T cells. CD14CD4+ cells were treated with 31.25 μg/ml SEVI and the indicated concentrations of surfen or chloroquine. Virion fusion was assessed as described in B of this figure. Error bars reflect standard deviations for triplicate determinations, and the data are representative of three independent experiments. Representative primary flow cytometric data for this graph are presented in supplemental Fig. 1.
FIGURE 2.
FIGURE 2.
Surfen inhibits SEVI- and semen-mediated enhancement of HIV-1 infection. 81A virions were pretreated for 5 min with the indicated concentration of SEVI (A) or semen (B) in the presence of 0, 10, 50, or 100 μm surfen. The samples were then diluted 15-fold (to final surfen concentrations of 0, 0.67, 3.3, or 6.7 μm as indicated) and added to TZM-bl cells. Medium was replaced after 2 h, and cells were assayed for Tat-inducible β-galactosidase activity 3 days later. The numbers above the bars indicate the n-fold infectivity enhancement relative to infection measured in the absence of SEVI or semen. C, comparing the effects of surfen and chloroquine on semen-mediated enhancement of HIV-1 infection. Samples were treated similar to B of this figure. RLU/s, relative light units/s. Shown are average values (± S.D.) of triplicate measurements from one of three independent experiments that yielded similar results.
FIGURE 3.
FIGURE 3.
Surfen inhibits the binding of SEVI to host cells. Top, FITC-labeled SEVI was either DMSO-treated (image on left) or treated with the indicated concentrations of surfen or chloroquine (images on right). The SEVI was then incubated with TZM-bl cells, washed, and imaged by laser scanning confocal microscopy. Shown are merged images of phase contrast (gray) and FITC-SEVI (green). Black bar, 30 μm. Bottom, quantification of the percentage of cell surface area associated with SEVI was carried out on 3–5 independent images for each condition. *, p < 0.05 (two-tailed t test). Lower magnification images of the same samples are presented in supplemental Fig. 4. Results are representative of one of five independent experiments.
FIGURE 4.
FIGURE 4.
Surfen blocks SEVI-mediated enhancement of HSPG-deficient pgs-A745 cells. A, expression of HSPG on CHO and pgs-A745 cells. CD4- and CCR5-expressing CHO and pgs-A745 cells were stained with an anti-heparan sulfate antibody and a secondary rat anti-mouse IgM. Unstained controls are shown as gray shaded histograms. B, luciferase-encoding HIV-1 virions were pretreated for 5 min with the indicated concentrations of SEVI in the absence or presence of 100 μm surfen, and then diluted 15-fold (to give a final surfen concentration of 6.7 μm) upon infection of the CHO or pgs-A745 transfectants. Medium was replaced after 2 h, and cells were assayed for luciferase activity 3 days later. Shown are average values (± S.D.) of triplicate measurements from one of three independent experiments that yielded similar results.
FIGURE 5.
FIGURE 5.
Surfen inhibits the binding of SEVI to HIV-1 in the absence of de-aggregating the fibrils. A, 50 μg/ml SEVI was incubated with HIV-1 81A (100 ng/ml p24Gag) in the presence of the indicated concentration of surfen. The fibrils were then centrifuged after 3 h, and the absolute amounts of p24Gag in the pellet and supernatant were determined by ELISA. The 1st lane is a negative control in which both surfen and SEVI were omitted. Values are the mean ± S.D. from one of three experiments that yielded similar results. B, 50 μg/ml SEVI was treated with the indicated concentration of surfen and then washed twice. The pretreated SEVI was then incubated with HIV-1 81A (100 ng/ml p24Gag) for 3 h. After centrifugation, the absolute amounts of p24Gag in the pellet and supernatant were determined by ELISA. The 1st lane is a negative control in which both surfen and SEVI were omitted. Values are the mean ± S.D. from one of three experiments that yielded similar results. C, SEVI was incubated with the indicated concentration of surfen and mixed with 5 μm thioflavin T, and emission at 482 nm was recorded. The 1st lane is a negative control in which SEVI was omitted. Results are representative of data obtained from two independent experiments. Shown are average values (± S.D.) of triplicate measurements. D, electron micrograph of SEVI fibrils incubated with the indicated concentrations of surfen. Black bar, 200 nm.

References

    1. Münch J., Rücker E., Ständker L., Adermann K., Goffinet C., Schindler M., Wildum S., Chinnadurai R., Rajan D., Specht A., Giménez-Gallego G., Sánchez P. C., Fowler D. M., Koulov A., Kelly J. W., Mothes W., Grivel J. C., Margolis L., Keppler O. T., Forssmann W. G., Kirchhoff F. (2007) Cell 131, 1059–1071 - PubMed
    1. Rönnberg L., Vihko P., Sajanti E., Vihko R. (1981) Int. J. Androl. 4, 372–378 - PubMed
    1. Roan N. R., Münch J., Arhel N., Mothes W., Neidleman J., Kobayashi A., Smith-McCune K., Kirchhoff F., Greene W. C. (2009) J. Virol. 83, 73–80 - PMC - PubMed
    1. Toyoshima K., Vogt P. K. (1969) Virology 38, 414–426 - PubMed
    1. Umber F., Stoerring F. K., Foellmer W. (1938) Klinische Wochenschrift. 17, 443–446

Publication types

MeSH terms