

Force-induced cleavage of single VWFA1A2A3 tridomains by ADAMTS-13
- PMID: 19897584
- PMCID: PMC2808159
- DOI: 10.1182/blood-2009-03-210369
Force-induced cleavage of single VWFA1A2A3 tridomains by ADAMTS-13
Abstract
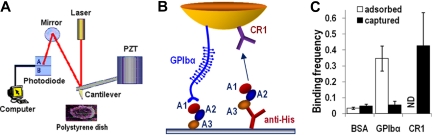
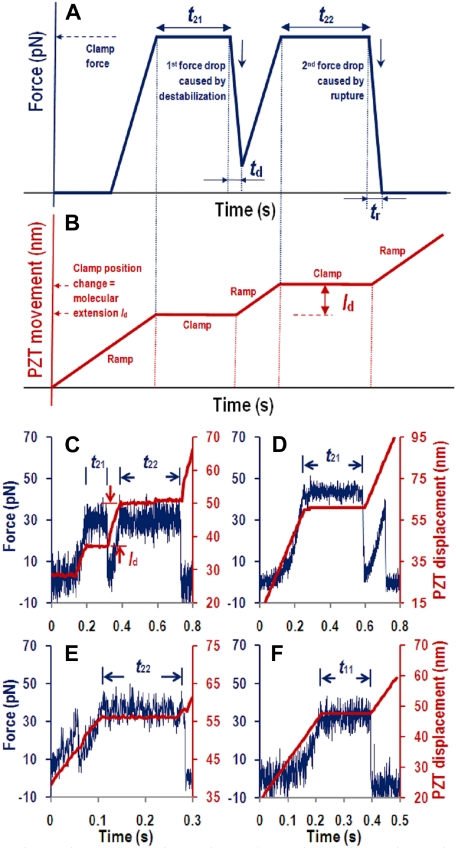
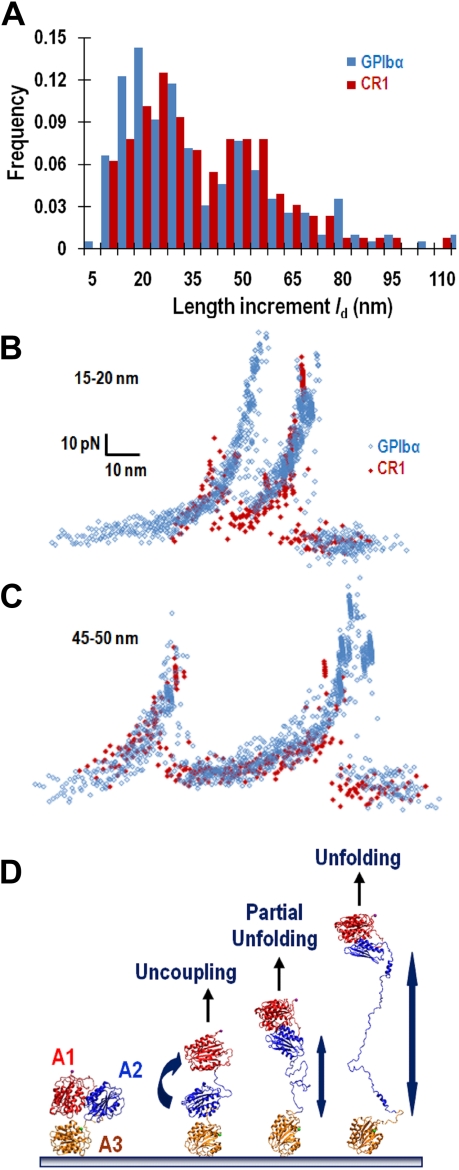
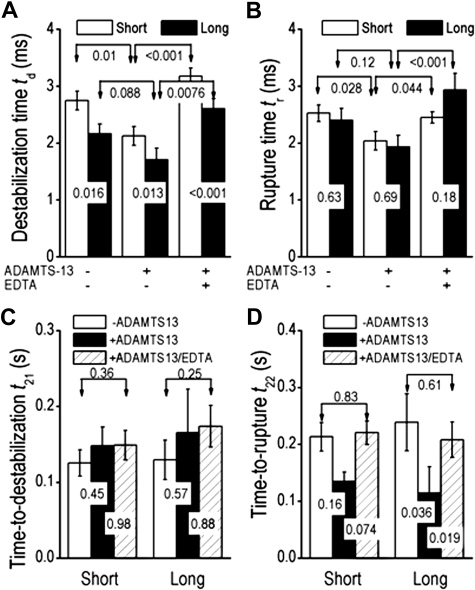
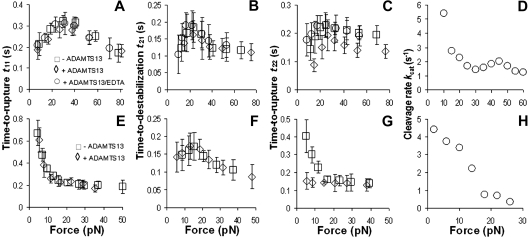
A disintegrin and metalloprotease with a thrombospondin type 1 motifs 13 (ADAMTS-13) regulates hemostasis by cleaving the folded A2 domain of von Willebrand factor (VWF). The cleavage is regulated by forces as it occurs in flowing blood. We tested the hypothesis that force-induced A2 domain unfolding facilitates cleavage using atomic force microscopy to pull single VWF A1A2A3 tridomain polypeptides by platelet glycoprotein Ibalpha or antibodies to measure time, distance, and force. Structural destabilization of A1A2A3 was induced by 5- to 80-pN forces, manifesting as an abrupt molecular length increase distributed around 20 and 50 nm, probably because of uncoupling A1A2A3 (or partially unfolding A2) and fully unfolding A2, respectively. Time required to destabilize A1A2A3 first increased (catch), reaching a maximum of 0.2 seconds at 20pN, then decreased (slip) with increasing force, independent of ADAMTS-13. The time required to rupture A1A2A3 exhibited a similar catch-slip behavior when pulled by glycoprotein Ibalpha but only slip behavior when pulled by antibody, which was progressively shortened by increasing concentration of ADAMTS-13 after (but not before) structural destabilization, indicating that cleavage of A2 requires the force-induced A2 unfolding. Analysis with a model for single-substrate trimolecular enzymatic kinetics estimated a cleavage rate k(cat) of 2.9 (+/- 59) seconds and a K(d) of 5.6 (+/- 3.4) nM for ADAMTS-13/A1A2A3 binding. These findings quantify the mechanical regulation of VWF cleavage by ADAMTS-13 at the level of single A1A2A3 tridomain.
Figures


Similar articles
-
Platelet glycoprotein Ibalpha forms catch bonds with human WT vWF but not with type 2B von Willebrand disease vWF.J Clin Invest. 2008 Sep;118(9):3195-207. doi: 10.1172/JCI35754. J Clin Invest. 2008. PMID: 18725999 Free PMC article.
-
Binding of platelet glycoprotein Ibalpha to von Willebrand factor domain A1 stimulates the cleavage of the adjacent domain A2 by ADAMTS13.Proc Natl Acad Sci U S A. 2004 Jul 20;101(29):10578-83. doi: 10.1073/pnas.0402041101. Epub 2004 Jul 12. Proc Natl Acad Sci U S A. 2004. PMID: 15249683 Free PMC article.
-
Simultaneous exposure of sites in von Willebrand factor for glycoprotein Ib binding and ADAMTS13 cleavage: studies with ristocetin.Arterioscler Thromb Vasc Biol. 2012 Nov;32(11):2625-30. doi: 10.1161/ATVBAHA.112.254144. Epub 2012 Aug 23. Arterioscler Thromb Vasc Biol. 2012. PMID: 22922961
-
Role of fluid shear stress in regulating VWF structure, function and related blood disorders.Biorheology. 2015;52(5-6):319-35. doi: 10.3233/BIR-15061. Biorheology. 2015. PMID: 26600266 Free PMC article. Review.
-
Structure and function of snake venom toxins interacting with human von Willebrand factor.Toxicon. 2005 Jun 15;45(8):1075-87. doi: 10.1016/j.toxicon.2005.02.023. Epub 2005 Apr 22. Toxicon. 2005. PMID: 15922776 Review.
Cited by
-
Moderate Constraint Facilitates Association and Force-Dependent Dissociation of HA-CD44 Complex.Int J Mol Sci. 2023 Jan 23;24(3):2243. doi: 10.3390/ijms24032243. Int J Mol Sci. 2023. PMID: 36768572 Free PMC article.
-
Structural basis of type 2A von Willebrand disease investigated by molecular dynamics simulations and experiments.PLoS One. 2012;7(10):e45207. doi: 10.1371/journal.pone.0045207. Epub 2012 Oct 23. PLoS One. 2012. PMID: 23110044 Free PMC article.
-
Biophysical nanotools for single-molecule dynamics.Biophys Rev. 2018 Oct;10(5):1349-1357. doi: 10.1007/s12551-018-0447-y. Epub 2018 Aug 18. Biophys Rev. 2018. PMID: 30121743 Free PMC article. Review.
-
Residues Arg568 and Phe592 contribute to an antigenic surface for anti-ADAMTS13 antibodies in the spacer domain.Haematologica. 2011 Nov;96(11):1670-7. doi: 10.3324/haematol.2010.036327. Epub 2011 Jun 28. Haematologica. 2011. PMID: 21712537 Free PMC article. Clinical Trial.
-
Mechanical regulation of T-cell functions.Immunol Rev. 2013 Nov;256(1):160-76. doi: 10.1111/imr.12122. Immunol Rev. 2013. PMID: 24117820 Free PMC article. Review.
References
-
- Sadler JE. Biochemistry and genetics of von Willebrand factor. Annu Rev Biochem. 1998;67:395–424. - PubMed
-
- Savage B, Almus-Jacobs F, Ruggeri ZM. Specific synergy of multiple substrate-receptor interactions in platelet thrombus formation under flow. Cell. 1998;94(5):657–666. - PubMed
-
- Sporn LA, Marder VJ, Wagner DD. Inducible secretion of large, biologically potent von Willebrand factor multimers. Cell. 1986;46(2):185–190. - PubMed
-
- Dong JF, Moake JL, Nolasco L, et al. ADAMTS-13 rapidly cleaves newly secreted ultralarge von Willebrand factor multimers on the endothelial surface under flowing conditions. Blood. 2002;100(12):4033–4039. - PubMed
Publication types
MeSH terms
Substances
Grants and funding
LinkOut - more resources
Full Text Sources
Miscellaneous
