. 2010 Mar;192(5):1175-83.
doi: 10.1128/JB.01245-09. Epub 2009 Nov 6.

P1 plasmid segregation: accurate redistribution by dynamic plasmid pairing and separation

Affiliations

P1 plasmid segregation: accurate redistribution by dynamic plasmid pairing and separation

Manjistha Sengupta et al. J Bacteriol. 2010 Mar.

Abstract

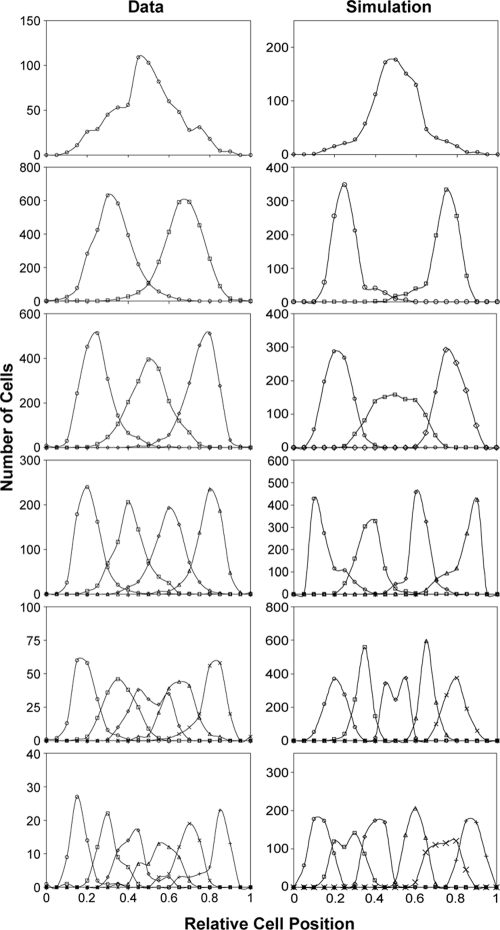
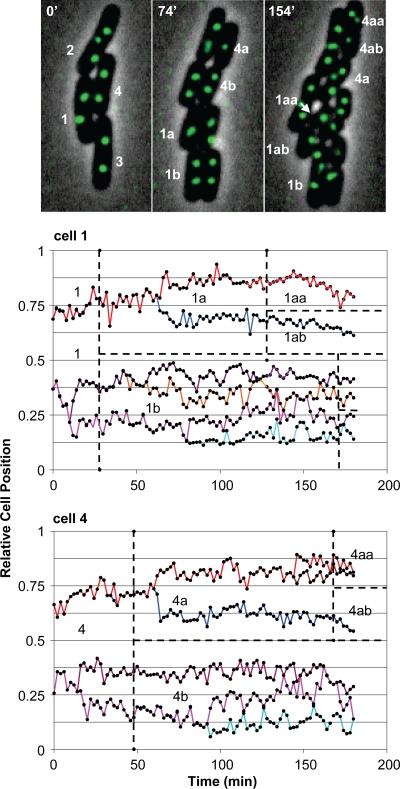
Low-copy-number plasmids, such as P1 and F, encode a type Ia partition system (P1par or Fsop) for active segregation of copies to daughter cells. Typical descriptions show a single central plasmid focus dividing and the products moving to the cell quarter regions, ensuring segregation. However, using improved optical and analytical tools and large cell populations, we show that P1 plasmid foci are very broadly distributed. Moreover, under most growth conditions, more than two foci are frequently present. Each focus contains either one or two plasmid copies. Replication and focus splitting occur at almost any position in the cell. The products then move rapidly apart for approximately 40% of the cell length. They then tend to maintain their relative positions. The segregating foci often pass close to or come to rest close to other foci in the cell. Foci frequently appear to fuse during these encounters. Such events occur several times in each cell and cell generation on average. We argue that foci pair with their neighbors and then actively separate again. The net result is an approximately even distribution of foci along the long cell axis on average. We show mathematically that trans-pairing and active separation could greatly increase the accuracy of segregation and would produce the distributions of foci that we observe. Plasmid pairing and separation may constitute a novel fine-tuning mechanism that takes the basic pattern created when plasmids separate after replication and converts it to a roughly even pattern that greatly improves the fidelity of plasmid segregation.


Figures

FIG. 1.
FIG. 1.
Distribution of plasmid foci. MG1655 cells containing the mini-P1 plasmid λP1:5RKm and expressing GFP-ParB were grown in minimal AB glucose Casamino Acid medium at 32°C, giving a 55-min generation time. (A) Typical field of cells. (B) The relative positions of the foci along the long axis in 600 cells are shown as a function of cell length. One-, 2-, 3-, and 4-focus cells have foci plotted as black, blue, orange, or green points, respectively. The vertical lines indicate the lengths of the average newborn and dividing cells. The horizontal lines mark the cell center and quarter positions. The dashed curves show the mean position of the nucleoid ends for a given cell size as determined by DAPI staining of the living cells.
FIG. 2.
FIG. 2.
The distribution of foci with respect to the cell center. (A) The percentages of all cells and of all dividing cells that have P1 foci disposed around the cell center are shown. The stippled cells would give rise to a plasmid-free cell if the cell divided without any change in plasmid number or position. (B) The percentages of four-focus cells and four-focus dividing cells that have the foci disposed as shown with respect to the cell center and cell quarters. Other possible configurations were not seen in the 1,111 four-focus cells examined. Dividing cells were identified automatically by the counting macro that finds cells with a central constriction in the cell outline; 5.9% of all cells in the population were identified as dividing by this method.
FIG. 3.
FIG. 3.
Distributions of mini-P1 plasmid foci. The distributions of foci along the long cell axis are shown relative to cell length. In each case, the mean points for the peaks are equally spaced from each other and the ends of the cells. (Left column) The relative distributions of cells with one to six foci from 6,500 cells as determined by fluorescence microscopy and automated focus measurement. (Right column) The relative distributions of cells with one to six foci from a population of 1,000 cells generated by a mathematical simulation run under standard conditions (see Materials and Methods).
FIG. 4.
FIG. 4.
Variations in ParA-GFP distribution. Time lapse microscopy of cells carrying a mini-P1 plasmid and expressing ParA-GFP was carried out. Various time windows were used. The maximum variability occurred using intervals of 4 min between frames. Only small variations in the distribution of ParA-GFP were seen in most cells. The image shows somewhat more variation than the average.
FIG. 5.
FIG. 5.
Time-lapse analysis of representative cells. (Top) Selected time-lapse images of a microcolony. (Bottom) The plotted tracks of cells 1 and 4. The colored lines distinguish the tracks of individual foci but do not necessarily indicate the actual focus lineage. The dashed lines indicate cell division.
FIG. 6.
FIG. 6.
Superimposed tracks of focus separation events. The time-lapse tracks are oriented so that the foci nearest to a cell pole are at the top of the graph. The tracks of foci in 7 different cells are shown in different colors. The tracks represent all the events from 23 observed cells where a focus split and the products stayed separate from themselves and other foci and did not split again for a considerable time. The colored lines are linear trend lines for the data points before and after the split. Splitting occurred at a wide variety of cell positions and times in the cell cycle. The tracks are aligned so that the time of the split and the position of the split in the trend lines define the zero values on the two axes.
FIG. 7.
FIG. 7.
Data from time-lapse images of cells 1 and 4b. The outlines of the cells were masked manually to distinguish them from the surrounding cells in the microcolony. Occasionally, a portion of a focus from an adjacent cell can still be seen at the mask boundary. The brightness of the faint focus in the cell 4b 160- to 164-min images has been manipulated to make it more easily visible. The white tracks represent the author's interpretation of focus movement between frames. Differences in focus size presumably reflect different amounts of GFP-ParB attached to the focus. The conservation of these size differences suggests that the identity of foci during pairing and separation events can be followed. For example, the small central focus in the series 158 min to 172 min appears to pair with the lower, larger focus and then to reverse its direction, returning toward the center. Similar but less obvious trends can be seen elsewhere in the cell 4b track.
FIG. 8.
FIG. 8.
Loss rates for a mathematical simulation of P1 plasmid partition. The program was run for 30 generations using the standard parameters listed in Materials and Methods. The result varied slightly for each time that the simulation was run, but the results were always similar. (A) Typical program output run under standard conditions. (B) Output run under the same conditions except that Lsep and eop were set to zero to prevent any pairing of plasmids after the initial replication and separation.
FIG. 9.
FIG. 9.
An interpretation of the behavior of P1 plasmids during partition. The green dots represent the partition site and its associated ParB protein. The red arrows represent ParA filaments involved in plasmid separation. A single resting plasmid is not a substrate for partition. On replication, the partition sites are paired, and ParA filaments associate and apply force to separate the sisters. This may be abortive until full topological resolution of the copies is achieved (b to c to d) or if the separated copies lie relatively near each other (b to c to d to b), but a wide separation will finally ensue, which will ensure segregation on cell division (e). When multiple copies are produced, rounds of pairing and separation eventually produce a pattern in which the copies are roughly evenly distributed (f through k). The illustrated behaviors occur both in vivo and in the mathematical simulation described in the text.

Comment in

References

    1. Adachi, S., K. Hori, and S. Hiraga. 2006. Subcellular positioning of F plasmid mediated by dynamic localization of SopA and SopB. J. Mol. Biol. 356:850-863. - PubMed
    1. Castaing, J. P., J. Y. Bouet, and D. Lane. 2008. F plasmid partition depends on interaction of SopA with non-specific DNA. Mol. Microbiol. 70:1000-1011. - PubMed
    1. Davis, M. A., and S. J. Austin. 1988. Recognition of the P1 plasmid centromere analog involves binding of the ParB protein and is modified by a specific host factor. EMBO J. 7:1881-1888. - PMC - PubMed
    1. Davis, M. A., K. A. Martin, and S. J. Austin. 1992. Biochemical activities of the ParA partition protein of the P1 plasmid. Mol. Microbiol. 6:1141-1147. - PubMed
    1. Davis, M. A., L. Radnedge, K. A. Martin, F. Hayes, B. Youngren, and S. J. Austin. 1996. The P1 ParA protein and its ATPase activity play a direct role in the segregation of plasmid copies to daughter cells. Mol. Microbiol. 21:1029-1036. - PubMed

Publication types

LinkOut - more resources