

Ecological specialization and population size in a biodiversity hotspot: how rare species avoid extinction
- PMID: 19897718
- PMCID: PMC2780933
- DOI: 10.1073/pnas.0901640106
Ecological specialization and population size in a biodiversity hotspot: how rare species avoid extinction
Abstract
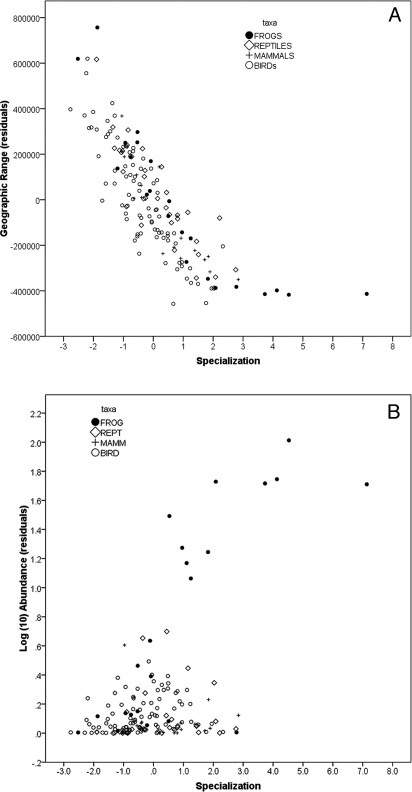
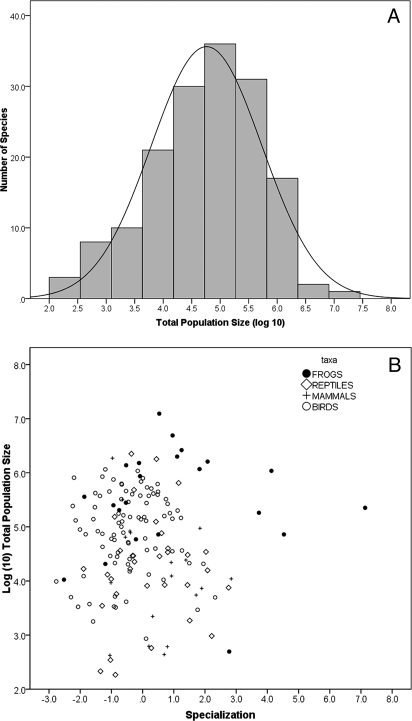
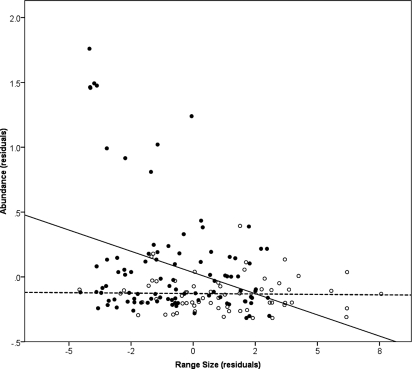
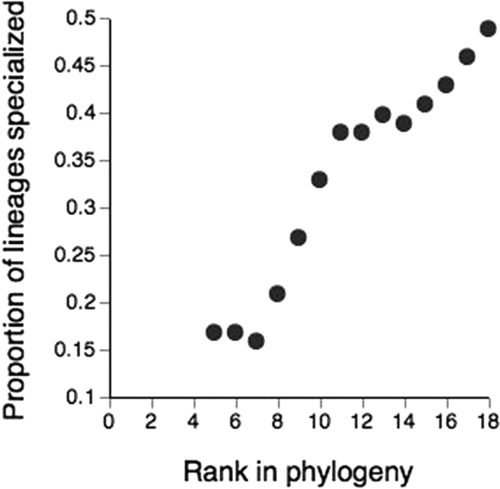
Species with narrow environmental niches typically have small geographic ranges. Small range size is, in turn, often associated with low local abundance. Together, these factors should mean that ecological specialists have very small total populations, putting them at high risk of extinction. But some specialized and geographically restricted species are ancient, and some ecological communities have high proportions of rare and specialized endemics. We studied niche characteristics and patterns of distribution and abundance of terrestrial vertebrates in the rainforests of the Australian Wet Tropics (AWT) to identify mechanisms by which rare species might resist extinction. We show that species with narrow environmental niches and small geographic ranges tend to have high and uniform local abundances. The compensation of geographic rarity by local abundance is exact, such that total population size in the rainforest vertebrates of the AWT is independent of environmental specialization. This effect would tend to help equalize extinction risk for specialists and generalists. Phylogenetic analysis suggests that environmental specialists have been gradually accumulating in this fauna, indicating that small range size/environmental specialization can be a successful trait as long as it is compensated for by demographic commonness. These results provide an explanation of how range-restricted specialists can persist for long periods, so that they now form a major component of high-diversity assemblages such as the AWT.
Conflict of interest statement
The authors declare no conflict of interest.
Figures
References
-
- Nix H. Biogeography: Pattern and process. In: Nix HA, Switzer MA, editors. Rainforest Animals: Atlas of Vertebrates Endemic to Australia's Wet Tropics. 1st Ed. Vol 1. Canberra: Australian National Parks and Wildlife; 1991. pp. 11–40.
-
- VanDerWal J, Shoo LP, Williams SE. New approaches to understanding late Quaternary climate fluctuations and refugial dynamics in Australian wet tropical rain forests. J Biogeogr. 2009;36:291–301.
-
- Williams SE. Vertebrates of the Wet Tropics Rainforests of Australia: Species distributions and biodiversity. Cairns, Australia: Rainforest-CRC; 2006.
-
- Hubbell SP. The Unified Neutral Theory of Biodiversity and Biogeography. Princeton: Princeton Univ Press; 2001. - PubMed
Publication types
MeSH terms
LinkOut - more resources
Full Text Sources
Other Literature Sources
