. 2009 Nov 24;106(47):20087-92.
doi: 10.1073/pnas.0905002106. Epub 2009 Nov 6.

Activation of TRPC1 by STIM1 in ER-PM microdomains involves release of the channel from its scaffold caveolin-1

Affiliations

Activation of TRPC1 by STIM1 in ER-PM microdomains involves release of the channel from its scaffold caveolin-1

Biswaranjan Pani et al. Proc Natl Acad Sci U S A. .

Abstract

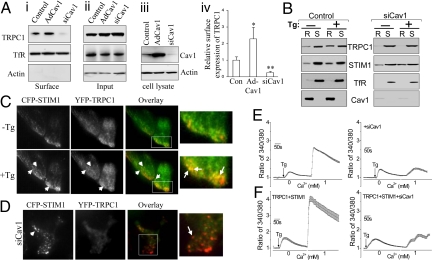
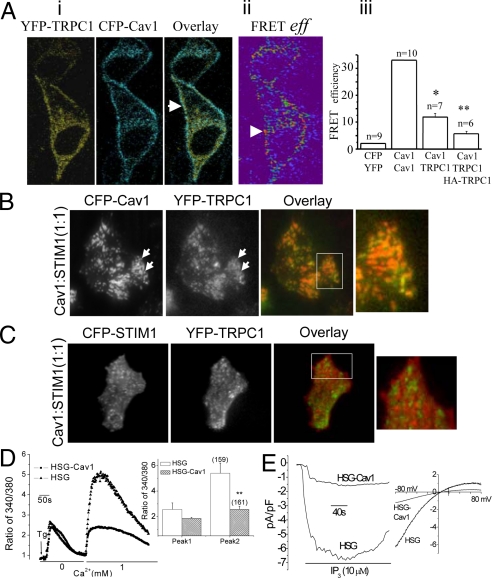
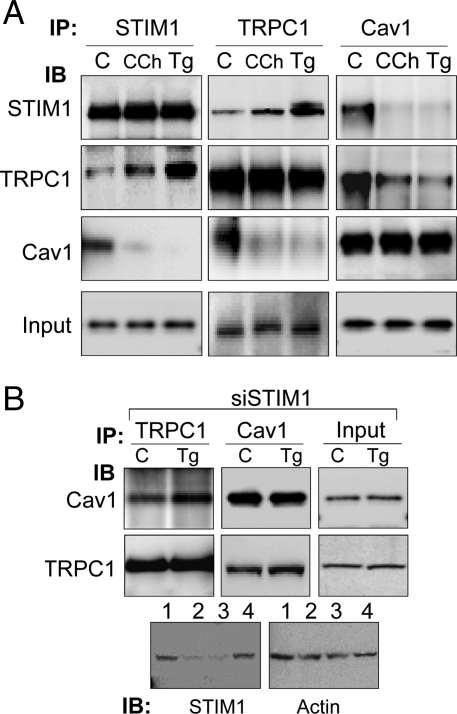
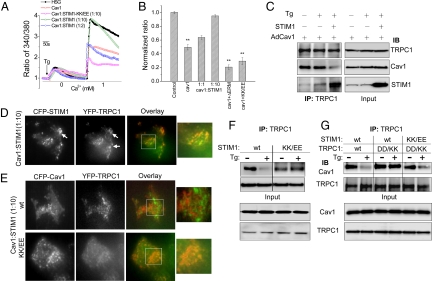
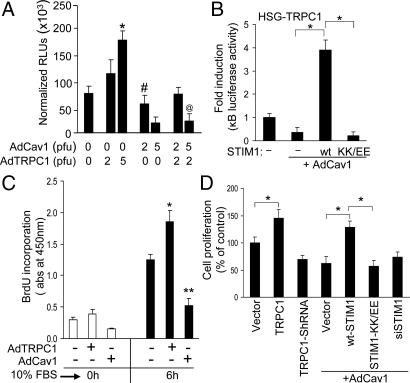
Store-operated Ca(2+) entry (SOCE) is activated by redistribution of STIM1 into puncta in discrete ER-plasma membrane junctional regions where it interacts with and activates store-operated channels (SOCs). The factors involved in precise targeting of the channels and their retention at these specific microdomains are not yet defined. Here we report that caveolin-1 (Cav1) is a critical plasma membrane scaffold that retains TRPC1 within the regions where STIM1 puncta are localized following store depletion. This enables the interaction of TRPC1 with STIM1 that is required for the activation of TRPC1-SOCE. Silencing Cav1 in human submandibular gland (HSG) cells decreased plasma membrane retention of TRPC1, TRPC1-STIM1 clustering, and consequently reduced TRPC1-SOCE, without altering STIM1 puncta. Importantly, activation of TRPC1-SOCE was associated with an increase in TRPC1-STIM1 and a decrease in TRPC1-Cav1 clustering. Consistent with this, overexpression of Cav1 decreased TRPC1-STIM1 clustering and SOCE, both of which were recovered when STIM1 was expressed at higher levels relative to Cav1. Silencing STIM1 or expression of DeltaERM-STIM1 or STIM1((684)EE(685)) mutant prevented dissociation of TRPC1-Cav1 and activation of TRPC1-SOCE. However expression of TRPC1-((639)KK(640)) with STIM1((684)EE(685)) restored function and the dissociation of TRPC1 from Cav1 in response to store depletion. Further, conditions that promoted TRPC1-STIM1 clustering and TRPC1-SOCE elicited corresponding changes in SOCE-dependent NFkB activation and cell proliferation. Together these data demonstrate that Cav1 is a critical plasma membrane scaffold for inactive TRPC1. We suggest that activation of TRPC1-SOC by STIM1 mediates release of the channel from Cav1.


Conflict of interest statement

The authors declare no conflict of interest.

Figures

Fig. 1.
Fig. 1.
Cav1 is required for plasma membrane expression of TRPC1 and clustering with STIM1. (A i–iii) Biotinylation of TRPC1 in control, Cav1-expressing (Ad-Cav1) and Cav1-silenced (siCav1) HSG cells. (Aiv) Relative surface expression of TRPC1, normalized to expression of transferin receptor (TfR). * and ** represent significant differences relative to control (Con), P < 0.05, and 0.01, respectively. (B) Tg-mediated recruitment of TRPC1 and STIM1 into lipid raft domains in control or siCav1 cells (R, insoluble fraction representing LRD; S, soluble fractions representing non-rafts). (C) TIRFM imaging of CFP-STIM1 (red) and YFP-TRPC1 (green) in resting (-Tg) and stimulated (+Tg) cells. Co-localization, yellow, is seen in overlay images (arrows indicate TRPC1-STIM1 clusters, enlarged areas shown; also see Movie S1). (D) Localization of CFP-STIM1 and YFP-TRPC1 in siCav1-treated cells after Tg stimulation (arrows indicate STIM1 puncta, red, which are not seen before stimulation). (E and F). Fura 2 fluorescence measurements in control and TRPC1+STIM1 expressing HSG cells (siCav1 treatment is indicated in traces on right). Each trace represents the average obtained from at least 50 cells.
Fig. 2.
Fig. 2.
Functional consequence of TRPC1-Cav1 association. (A) FRET measurements in HSG cells expressing YFP-TRPC1 and CFP-Cav1. (i) Localization of the proteins (shown by arrows). (ii) Detection of FRET. (iii) Quantitation of data (FRETeff ± SEM); a significant difference (*, P < 0.05) was noted between Cav1-TRPC1 vs. YFP-CFP or Cav1-TRPC1-HATRPC1; and (**, P < 0.05) between Cav1-TRPC1 vs. Cav1-TRPC1-HATRPC1. (B) Localization of CFP-Cav1 (red) and YFP-TRPC1 (green) in Tg-stimulated HSG cells expressing HA-STIM1 (1:1 cDNA ratio of STIM1 relative to CFP-Cav1). Images before stimulation are not shown since there was no change with stimulation. (C) Localization of CFP-STIM1 and YFP-TRPC1 in Tg-stimulated cells expressing HA-Cav1 (1:1 cDNA ratio of STIM1 and Cav1). (D) Tg-stimulated calcium changes in HSG cells transfected with Cav1, bar graph shows quantitation. (E) ISOC measurements in Cav1-expressing HSG cells with IP3 in the pipette solution (similar data were obtained with Tg).
Fig. 3.
Fig. 3.
Store depletion induces STIM1-dependent dissociation of TRPC1 from Cav1. (A) Co-immunoprecipitation of endogenous STIM1, TRPC1, and Cav1 from control (C), or Tg or CCh-stimulated HSG cells. (B) Co-immunoprecipitation of TRPC1 and Cav1 in STIM1-silenced HSG cells (siSTIM1) under unstimulated (C) or stimulated (Tg) conditions. Bottom panel shows STIM1 levels in control (lane 1), siSTIM1-treated (lanes 2 and 3, respectively), and non-targeting siRNA (lane 4), and actin as control.
Fig. 4.
Fig. 4.
Overexpression of functional STIM1 induces recovery of TRPC1-SOCE. (A and B) Fura 2 measurements in HSG cells expressing Cav1, Cav1+wt-STIM1 (1:2 cDNA ratio), Cav1+wt-STIM1 (1:10 cDNA ratio), Cav1+ΔERM-STIM1, and STIM1-KK/EE (each at 1:10 cDNA ratio of Cav1 relative to STIM1). ** indicates statistically significant (P < 0.05) difference from control values. (C) Co-immunoprecipitation of TRPC1 and Cav1 from cells expressing Cav1 alone or with STIM1 in resting and Tg-stimulations. (D) Localization of CFP-STIM1+YFP-TRPC1 in HA-Cav1-expressing cells. (E) Localization of CFP-Cav1+YFP-TRPC1 in wt-STIM1 or STIM1-KK/EE expressing cells (in D and E STIM1:Cav1 was used at 10:1). (F) Immunoprecipitation of TRPC1 from cells expressing either wt-STIM1 or STIM1-KK/EE. Input protein levels are shown in the lower blots. (G) Immunoprecipitation of TRPC1 from cells expressing wt-STIM1 with wt-TRPC1; wt-STIM1 with TRPC1-DD/KK; or STIM1-KK/EE with TRPC1-DD/KK. Input protein levels are shown in the lower blots. Anti-TRPC1 was used for IP in Fig. 4 F and G.
Fig. 5.
Fig. 5.
Relative effects of STIM1 and Cav1 on TRPC1-SOCE dependent NF-κB activation and cell proliferation. (A) NF-κB activity in HSG cells expressing TRPC1, Cav1, or TRPC1+Cav1. Normalized relative luciferase units (RLUs) are plotted as mean ± SD. *, P < 0.01 indicates value significantly different from control HSG cells without any exogenous expression. # and @ denote values significantly different (P < 0.01) from TRPC1-overexpressing cells and also significantly different (P < 0.05) from control cells. (B) NF-κB activity in cells expressing wt-STIM1 or STIM1-KK/EE and Cav1. Under these expression conditions, the basal NF-κB activities before serum stimulation are presented in Fig. S3B. Data are normalized to luciferase activity in control HSG cells. *P < 0.01 indicates difference of values compared to cells overexpressing Cav1 alone. (C) BrdU incorporation in control, TRPC1 and Cav1 over-expressing HSG cells. * and ** indicate values significantly different from control HSG cells (P < 0.05). (D) Cell proliferation (MTT assays) performed on asynchronously growing HSG cells transfected with the desired plasmids and AdCav1 (2 pfu). Relative cell proliferation is shown. *, P < 0.05 indicates values significantly different from corresponding vector controls.

References

    1. Putney JW, Jr, Broad LM, Braun F-J, Lievremont J-P, Bird GSJ. Mechanisms of capacitative calcium entry. J Cell Sci. 2001;114:2223–2229. - PubMed
    1. Luik RM, Wang B, Prakriya M, Wu MM, Lewis RS. Oligomerization of STIM1 couples ER calcium depletion to CRAC channel activation. Nature. 2008;454:538–542. - PMC - PubMed
    1. Liou J, Fivaz M, Inoue T, Meyer T. Live-cell imaging reveals sequential oligomerization and local plasma membrane targeting of stromal interaction molecule 1 after Ca2+ store depletion. Proc Natl Acad Sci USA. 2007;104:9301–9306. - PMC - PubMed
    1. Roos J, et al. STIM1, an essential and conserved component of store-operated Ca2+ channel function. J Cell Biol. 2005;169:435–445. - PMC - PubMed
    1. Ong HL, et al. Relocalization of STIM1 for activation of store-operated Ca2+ entry is determined by the depletion of subplasma membrane endoplasmic reticulum Ca2+ store. J Biol Chem. 2007;282:12176–12185. - PMC - PubMed

Publication types

MeSH terms

LinkOut - more resources