. 2009 Dec;6(12):883-9.
doi: 10.1038/nmeth.1399. Epub 2009 Nov 8.

A genetically encoded reporter of synaptic activity in vivo

Affiliations

A genetically encoded reporter of synaptic activity in vivo

Elena Dreosti et al. Nat Methods. 2009 Dec.

Abstract

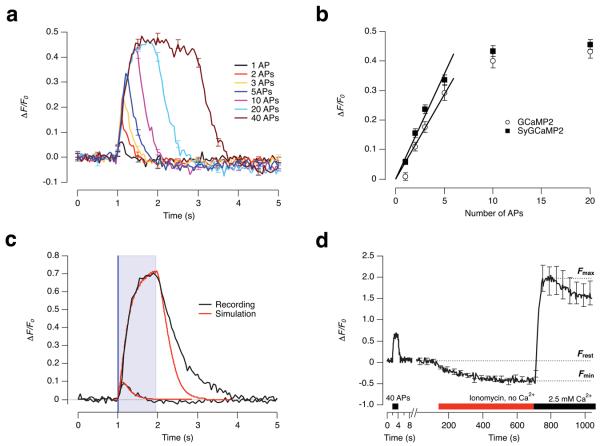
To image synaptic activity within neural circuits, we tethered the genetically encoded calcium indicator (GECI) GCaMP2 to synaptic vesicles by fusion to synaptophysin. The resulting reporter, SyGCaMP2, detected the electrical activity of neurons with two advantages over existing cytoplasmic GECIs: it identified the locations of synapses and had a linear response over a wider range of spike frequencies. Simulations and experimental measurements indicated that linearity arises because SyGCaMP2 samples the brief calcium transient passing through the presynaptic compartment close to voltage-sensitive calcium channels rather than changes in bulk calcium concentration. In vivo imaging in zebrafish demonstrated that SyGCaMP2 can assess electrical activity in conventional synapses of spiking neurons in the optic tectum and graded voltage signals transmitted by ribbon synapses of retinal bipolar cells. Localizing a GECI to synaptic terminals provides a strategy for monitoring activity across large groups of neurons at the level of individual synapses.


Figures

Figure 1
Figure 1. Modelling GCaMP2 responses in the synapse and axon
(a) Geometry of the 2-D model implemented in Virtual Cell. (b) Calcium buffers, channels and pumps used in the model. Distribution of calcium channels at the active zone is shown in red while distribution of synaptic vesicles in cyan. (c) The modelled response of GCaMP2 (1 μM) to a single spike (green trace) calculated as the relative change in GCaMP2 fluorescence in an ROI over the bouton. The black trace is the spatially averaged Ca2+ concentration reported by cytoplasmatic furaptra, also averaged over the whole bouton. This signal was obtained by adjusting the parameters of the model to reproduce the response to a single spike reported by furaptra. Note the slower GCaMP2 signal compared to the Ca2+ transient. (d) Simulations of GCaMP2 signals at different distances from calcium channels: within 50 nm of the active zone (red); averaged over the bouton (cyan); over a 2.25 μm length of axon close to the bouton (amber), and over the next 2.25 μm length of axon (blue). (e and f) Neuronal-glial cultures of rat hippocampi expressing cytoplasmic GCaMP2 (e) or synaptic SyGCaMP2 (f). Expression of the synaptic marker mRFP-VAMP is shown in the middle and merged images to the right. The rectangular field of view is expanded in the images below. Only SyGCaMP2 visualizes all synaptic boutons marked by mRFP-VAMP. For equipment and settings see Supplementary Methods online. Scale bars = 20 μm.
Figure 2
Figure 2. Presynaptic calcium signals visualized with SyGCaMP2
(a) Cultured neurons expressing SyGCaMP2 (grey-scale image, left) and pseudocoloured images showing the relative change in fluorescence at rest, then 0.2 s and 1 s after the beginning of a train of 10 APs delivered at 20 Hz. Note the variability in the amplitude of the presynaptic calcium signal between different boutons. For equipment and settings see Supplementary Methods. Scale bar = 20 μm. (b) SyGCaMP2 responses from 20 individual boutons shown in a (red traces) and their average (black). (c) Graph showing fluorescence responses to 1 AP from 100 synapses in the field in a. (d) SyGCaMP2 responses to a single AP from 20 individual boutons (red traces) and the average (black). (e) Histogram showing the distribution of SyGCaMP2 responses to 1 AP measured at their peak. The mean amplitude was 11.5 %. (f) The distribution of SNRs measured at different boutons in response to 1 AP, again from the field shown in a. SNR was measured as the peak amplitude of the response divided by the standard deviation in the signal at rest, as shown in g. (g) Response to a single AP averaged from three neighbouring boutons shown in the red box in a. Note this was a single trial. The peak amplitude of the signal was 22% and the noise in the baseline had a standard deviation of 3%, yielding a SNR of 7.3 for the average.
Figure 3
Figure 3. The dynamic range of SyGCaMP2 responses
(a) Average SyGCaMP2 responses to trains of 1, 2, 3, 5, 10, 20 and 40 APs at 20 Hz. Each trace represents 500 synapses from 6 different cover slips. Error bars show s.e.m. (b) Peak amplitude of the SyGCaMP2 response (squares) taken from a as a function of the number of APs delivered. GCaMP2 responses (circles) are also plotted (Error bars, s.e.m.; n=450 synapses from 5 different cover slips). When using GCaMP2, boutons were identified by co-expressing mRFP-VAMP2. The response of SyGCaMP2 was linear up to ~8 APs, with a proportionality constant of 7 ± 0.3 % per AP for SyGCaMP2 and 5 ± 0.4 % for GCaMP2. (c) Comparison of experimental SyGCaMP2 measurements (black traces) and their simulations (red). The model accurately predicts the response to 1 AP as well as the saturating response to 20 APs at 20 Hz. The model does not account for the slower recovery of the SyGCaMP2 signal after the introduction of larger calcium loads. (d) SyGCaMP2 response to 40 APs delivered at 20 Hz (70% increase). Neurons were then perfused with ionomycin (5 μM), 0 Ca2+, and 10 mM EGTA. The minimum fluorescence (ΔF/F0min) was −0.55 relative to rest. The external [Ca2+] was then increased to 2.5 mM to saturate SyGCaMP2. The peak signal (ΔF/F0max) was 2.1. Assuming a Hill coefficient of 4 for the binding of Ca2+ to GCaMP2 and a Kd of 150 nM, the resting free [Ca2+] is estimated to be ~2 nM.
Figure 4
Figure 4. Deconvolution of SyGCaMP2 signals to monitor spike activity
(a) A “physiological” stimulus pattern (1ms, 20mA) delivered to the hippocampal cultures simulating the spike activity recorded in the hippocampus of a sleeping rat in vivo (courtesy of Matt Jones, Bristol). (b) The upper graph shows the SyGCaMP2 signal averaged from 10 synaptic boutons of a single neuron responding to the stimulus in a. Images were acquired in 50 ms intervals. The lower graph shows the spike frequency reconstructed by deconvolution of the SyGCaMP2 signal with the impulse response shown in the inset (decaying with τ = 250 ms). (c) The ideal reconstruction of spike frequency obtained by counting spikes into 50 ms time bins (the frame duration when imaging SyGCaMP2). Note that the reconstruction agrees closely with the ideal for brief bursts of spikes measured physiologically. (d) Spike frequency reconstructed by deconvolution for four different SyGCaMP2 experiments (each from a different cover slip). SyGCaMP2 signals were averaged from 10 synaptic boutons each. The bottom graph shows the ideal reconstruction from c for comparison (e) The reconstructed spike rate against the ideal spike rate for experiments shown in d (error bars: s.e.m.)
Figure 5
Figure 5. Monitoring synaptic activity in the optic tectum of zebrafish
(a) Optic tectum of a zebrafish (9 dpf) transiently expressing SyGCaMP2 under the α-tubulin promoter. The red box indicates the area imaged in the head and the white dashed line the midline. For equipment and settings see Supplementary Methods. Scale bar = 100 μm. The white dashed box shows the region zoomed into for recordings shown in (b). Scale bar = 20 μm. (c) ROIs corresponding to single synapses in b. Terminals responding to light are in amber. (d) Raster plot showing 100 SyGCaMP2 signals from terminals marked in c, elicited by an electric field or a light stimulation (e) shown in bottom panels of f or h, respectively. Imaging frequency 20 Hz; 256×50 pixels. (f) Top: SyGCaMP2 signals averaged from 12 terminals (from different area of the tectum, same fish). Middle: Relative Spike Frequency (R.S.F.) calculated by deconvolution using the minimum impulse response (rising and decay time-constants of 50 and 350 ms). Bottom: pattern of field stimulation. (g) R.S.F. plotted against the frequency of electrical stimulation (1 ms pulses) obtained from four different experiments in different areas of the tectum. Note linearity. Error bars: s.e.m. (h) Traces of two SyGCaMP2 signals from amber terminals in c, responding to two identical light stimuli (square wave, 100% modulation at 2 Hz, 50% duty cycle, 590 nm). The amplitude of the light responses do not exceed the average amplitude of the minimal field stimulus. (i) Estimate of the R.S.F calculated by deconvolution of the traces in h.
Figure 6
Figure 6. Monitoring synaptic activity in the retina of zebrafish
(a) The eye of a larval zebrafish (9 dpf) expressing SyGCaMP2 under control of the ribeye promoter. Photoreceptor terminals appear in the outer plexiform layer (OPL) and bipolar cell terminals in the inner plexiform layer (IPL). Scale bar = 50 μm. (b) The IPL in a different fish (9 dpf) expressing SyGCaMP2 (above) and the ROIs in which SyGCaMP2 signals were measured shown in different colours (below). Scale bar = 20 μm. (c) Graph showing fluorescence responses from 80 terminals shown in b. Two light stimuli (blue; 490nm) were applied: a steady uniform one followed by a flickering one (2 Hz square wave, 100% modulation, 50% duty cycle). Images were collected every 128 ms. (d) Some example traces of different types of SyGCaMP2 responses in terminals from c. The colours and numbers of the traces correspond to the ROIs in b.

Comment in

References

    1. Garaschuk O, Milos RI, Grienberger C, et al. Optical monitoring of brain function in vivo: from neurons to networks. Pflügers Arch. 2006;453(3):385–396. - PubMed
    1. Gobel W, Helmchen F. In vivo calcium imaging of neural network function. Physiology (Bethesda) 2007;22:358–365. - PubMed
    1. Pologruto TA, Yasuda R, Svoboda K. Monitoring neural activity and [Ca2+] with genetically encoded Ca2+ indicators. J. Neurosci. 2004;24(43):9572–9579. - PMC - PubMed
    1. Reiff DF, Ihring A, Guerrero G, et al. In vivo performance of genetically encoded indicators of neural activity in flies. J. Neurosci. 2005;25(19):4766–4778. - PMC - PubMed
    1. Mao T, O'Connor DH, Scheuss V, Nakai J, Svoboda K. Characterization and subcellular targeting of GCaMP-type genetically-encoded calcium indicators. PLoS ONE. 2008;3(3):e1796. - PMC - PubMed

Publication types