Comparative Study
. 2009 Oct;5(10):e1000644.
doi: 10.1371/journal.ppat.1000644. Epub 2009 Oct 30.

Comparative transcriptional and genomic analysis of Plasmodium falciparum field isolates

Affiliations
Comparative Study

Comparative transcriptional and genomic analysis of Plasmodium falciparum field isolates

Margaret J Mackinnon et al. PLoS Pathog. 2009 Oct.

Abstract

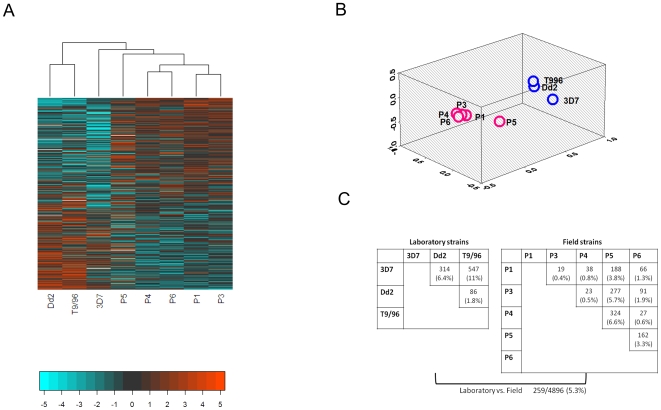
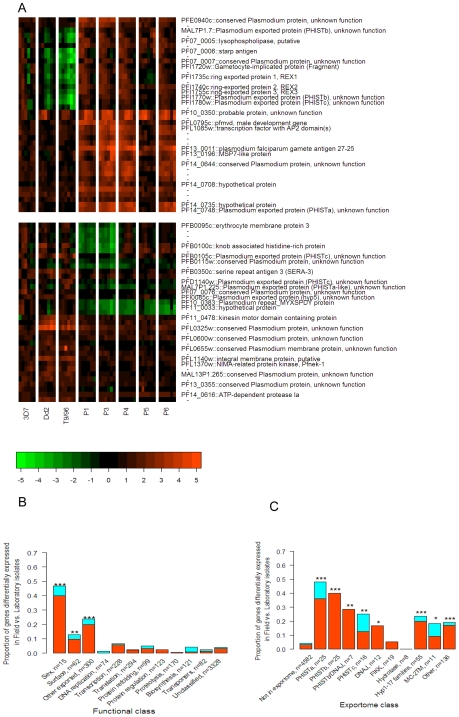
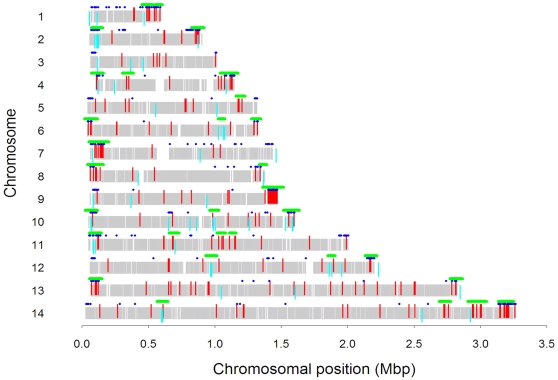
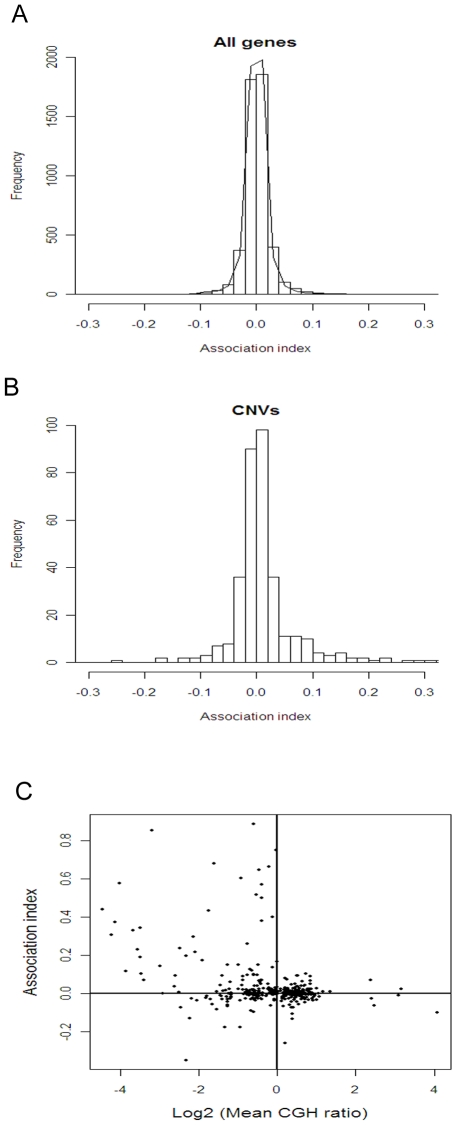
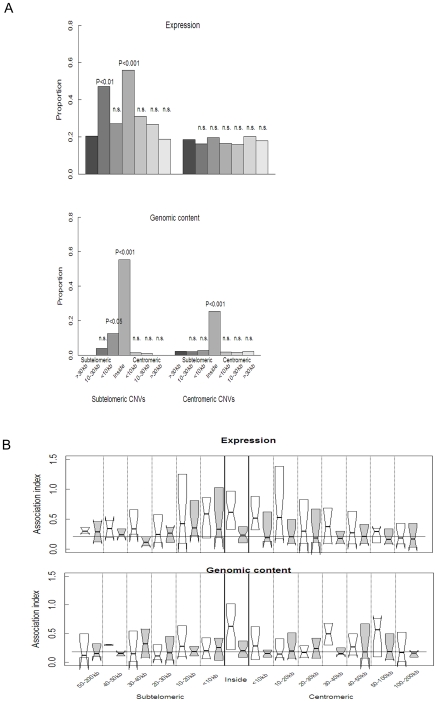
Mechanisms for differential regulation of gene expression may underlie much of the phenotypic variation and adaptability of malaria parasites. Here we describe transcriptional variation among culture-adapted field isolates of Plasmodium falciparum, the species responsible for most malarial disease. It was found that genes coding for parasite protein export into the red cell cytosol and onto its surface, and genes coding for sexual stage proteins involved in parasite transmission are up-regulated in field isolates compared with long-term laboratory isolates. Much of this variability was associated with the loss of small or large chromosomal segments, or other forms of gene copy number variation that are prevalent in the P. falciparum genome (copy number variants, CNVs). Expression levels of genes inside these segments were correlated to that of genes outside and adjacent to the segment boundaries, and this association declined with distance from the CNV boundary. This observation could not be explained by copy number variation in these adjacent genes. This suggests a local-acting regulatory role for CNVs in transcription of neighboring genes and helps explain the chromosomal clustering that we observed here. Transcriptional co-regulation of physical clusters of adaptive genes may provide a way for the parasite to readily adapt to its highly heterogeneous and strongly selective environment.


Conflict of interest statement

The authors have declared that no competing interests exist.

Figures

Figure 1
Figure 1. Overview of Pairwise Comparison of Transcriptional Differences between P. falciparum Laboratory and Field Strains.
A. Heat map representing each strain's (column) expression values for all genes (rows). Rows are ordered top to bottom according to the maximum difference between field and laboratory isolates. Values represented by colors (red, positive; blue, negative) are summary measures over time points (averages across the life cycle, as output from the statistical model) of the strain's log2 expression value relative to the reference material. Values are mean-normalized across rows to highlight between-strain differences. Hierarchical clustering of the column data yielded a dendrogram that broadly separated the laboratory and field strains into two clusters with 3D7 falling somewhere between these groups. B. When represented by a 3-dimensional principal coordinates plot in which distances between points indicate the degree in similarity between strains across their whole genome expression profile, laboratory and field isolates fall into two distinct clusters. C. Tests of significance revealed that 5.3% of genes were significantly differentially expressed between laboratory and field strains (>1.5-fold difference, P<0.01 after allowing for multiple testing and including genes for which the majority of probes per gene were significant). 3D7 and P5 were more different from their counterparts than other strains.
Figure 2
Figure 2. Genes that Differed Most Between Field and Laboratory Isolates and Their Functional Classification.
A. Individual time point expression profiles for the 20 up-regulated (top panel) and 20 down-regulated genes (bottom panel) with lowest P-values in field vs. laboratory isolates comparisons. Rows are sorted by chromosomal location. All probes per gene, whether significant or not, are shown to illustrate the good correspondence across probes within gene. The data shown are actual expression values relative to the 3D7 reference material on the log2 scale (see color bar), i.e., they have not been row-mean normalized. B. Genes were classified according to function based on their PlasmoDB annotations and GO terms, and bioinformatics studies (Table S1). The proportion of each class that was differentially expressed (>1.5-fold difference and P<0.01) between field and laboratory isolates was significantly higher in genes coding for sexual stage parasites, surface proteins and genes containing an export motif (exportome) than for other genes. Differentially regulated genes tended to be more often up-regulated (red) than down-regulated (light blue). C. Genes were classified according to their class within the exportome . With the exceptions of the Maurer's Cleft genes (MC-2TM) and the FIKK kinases, all of the sub-classes had significantly higher numbers of up-regulated in field vs. laboratory isolates than non-exportome genes (left bar). Numbers per class are shown in the axis labels. Significance levels for differences in proportions of each class vs. all other classes using the hypergeometric test are indicated by *, P<0.05; **, P<0.01; ***, P<0.001.
Figure 3
Figure 3. Chromosomal Location of Genes Differentially Expressed between Field and Laboratory Strains.
Chromosomal locations of genes that had significantly (P<0.01, >1.5-fold difference) higher (red) or lower (light blue) expression levels in field vs. laboratory strains in at least half of their probes. Regions in which there were significantly more (P<0.05) differentially regulated genes than expected by chance (i.e., clustering) are indicated by a green bar above the chromosome. Genes belonging to the exportome are indicated by blue dots above the chromosome. Vertical grey bars indicate the locations of genes included in these analyses.
Figure 4
Figure 4. Associations Between Expression Levels and Genomic DNA Content among Field Isolates.
Regression coefficients of normalized hybridization signals from cDNA on normalized hybridization signals from gDNA in the 5 field isolates were calculated for each gene. A. The frequency distribution of these coefficients (association index) across all genes was more dispersed than expected by chance (black line, obtained by randomly shuffling the data across isolates within each gene, P<0.001 by Kolmogorov-Smirnov test). B. Genes that showed variation at the genome level (CNVs) had a higher frequency of strong positive and strong negative associations than genes that did not (P<0.001 by Kolmogorov-Smirnov test). C. Genes with reduced genomic content relative to 3D7 had stronger associations, both positive and negative, with expression levels than genes with equivalent genomic content to 3D7. Only data from genes showing significant variation at the genomic level are shown in C.
Figure 5
Figure 5. Co-regulation of Genes Surrounding CNVs.
A. Proportion of genes significantly differentially regulated between field and laboratory isolates or among field isolates (upper), and showing significant between-strain variation at the genomic level (lower), grouped by distance of the gene from the CNV boundary on either the subtelomeric side or centromeric side. P-values (by Fisher's Exact test) indicate where the proportion of significant genes differ from that >30kb on the subtelomeric side of the CNV. Analyses have been split by whether the CNV occurs in the subtelomeric (left) or internal (right) regions of the chromosome. B. Across-strain (field and laboratory strains) measures of association (absolute values of regression coefficients, white bars) between expression levels (upper, white bars) of a single differentially expressed gene within a CNV (index gene) and expression levels in differentially expressed genes surrounding the CNV (test gene) grouped by distance from the CNV boundary. The same analysis was performed for genomic content data (lower). For comparison to that expected by chance, associations after randomly permuting the data across strains within genes are shown in grey boxes. The horizontal line inside each box shows the median, the box boundaries show the interquartile range, the whisker length is one interquartile range, the box width is proportional to the square root of the number of observations per group, and the notches show the approximate 95% confidence intervals, i.e., non-overlapping notches strongly support a hypothesis of non-equivalence . The horizontal line across all the boxes indicates the median value for the association index of permuted values on all genes after excluding data for genes inside the CNV, i.e., the expected value of the association index from chance alone for test genes outside CNVs. Regression analysis of expression data from individual genes showed a significant decline in the magnitude of across-strain associations with distance from the CNV boundary (P<0.001) which was stronger than for randomized data (P<0.05), and was not observed for genomic content data (P>0.5). (See main text for details).

References

    1. Snow RW, Guerra CA, Noor AM, Myint HY, Hay SI. The global distribution of clinical episodes of Plasmodium falciparum malaria. Nature. 2005;434:214–217. - PMC - PubMed
    1. White NJ. Drug resistance in malaria. Br Med Bull. 1998;54:703–715. - PubMed
    1. Gandon S, Mackinnon MJ, Nee S, Read AF. Imperfect vaccines and the evolution of parasite virulence. Nature. 2001;414:751–755. - PubMed
    1. Mackinnon MJ, Read AF. Virulence in malaria: an evolutionary viewpoint. Phil Trans R Soc Lond B. 2004;359:965–986. - PMC - PubMed
    1. Maier AG, Rug M, O'Neill MT, Brown M, Chakravorty SJ, et al. Exported proteins required for virulence and rigidity of Plasmodium falciparum-infected human erythrocytes. Cell. 2008;134:46–61. - PMC - PubMed

Publication types

MeSH terms