. 2010 Mar;4(1):1-24.
doi: 10.1007/s11571-009-9098-9. Epub 2009 Nov 7.

Mapping of contextual modulation in the population response of primary visual cortex

Affiliations

Mapping of contextual modulation in the population response of primary visual cortex

David M Alexander et al. Cogn Neurodyn. 2010 Mar.

Abstract

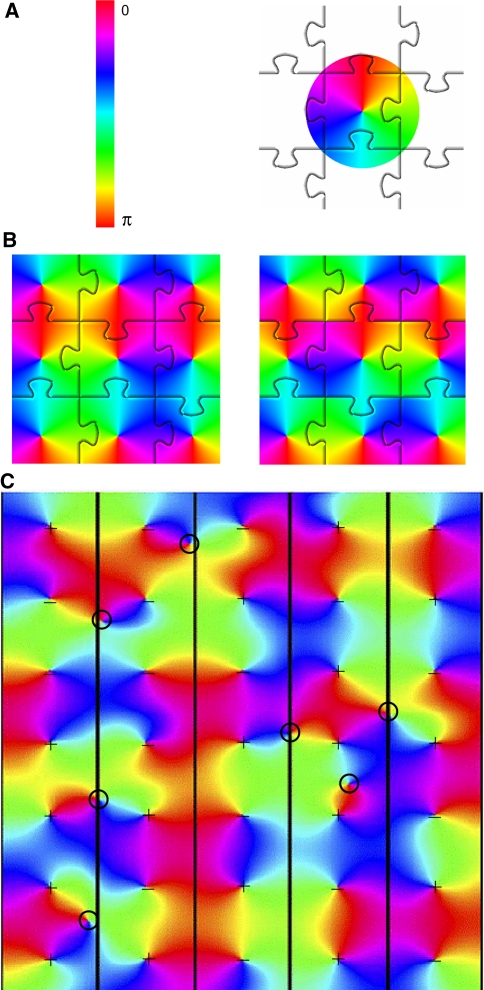
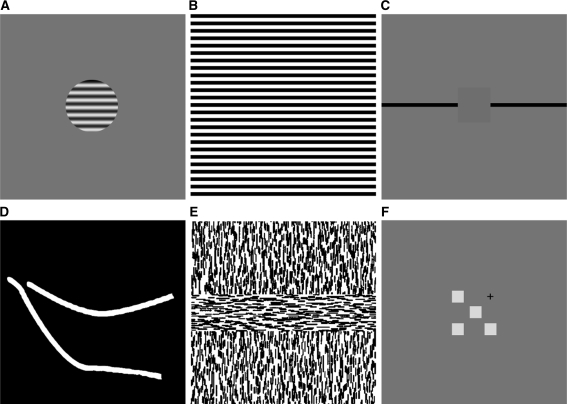
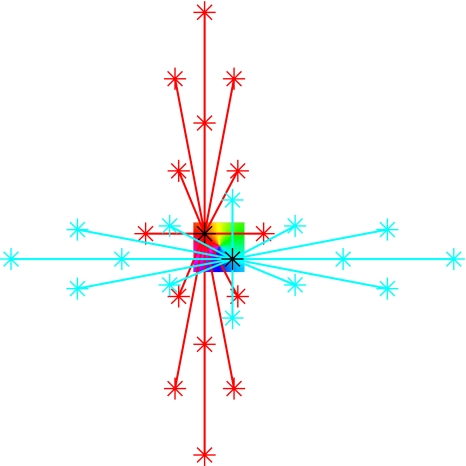
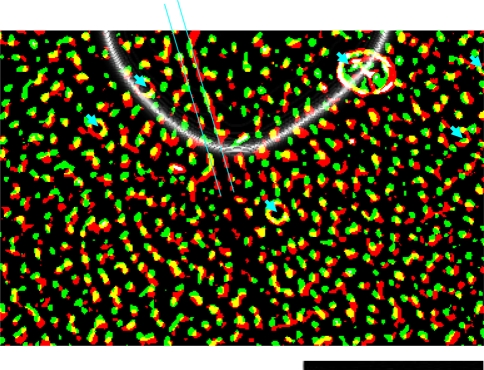
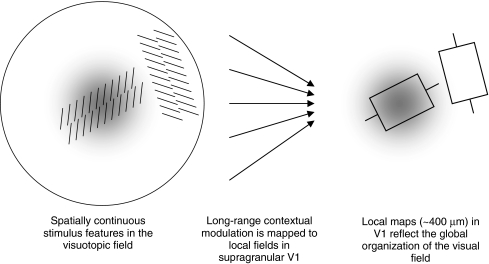
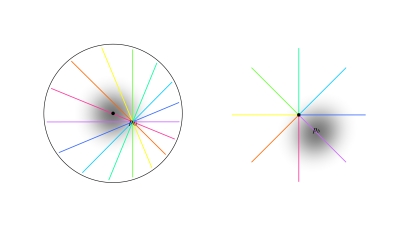
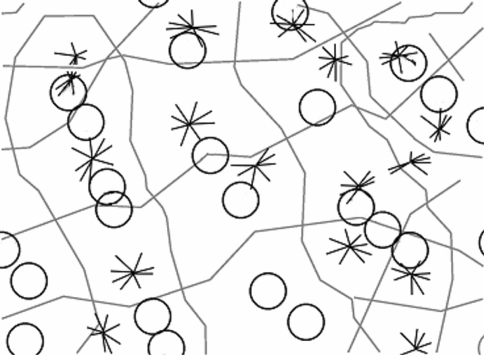
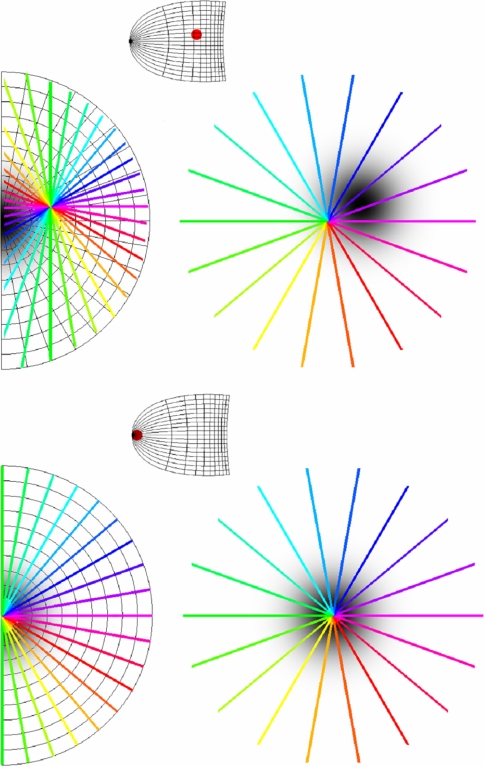
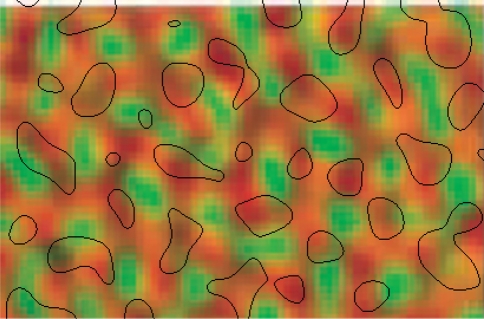
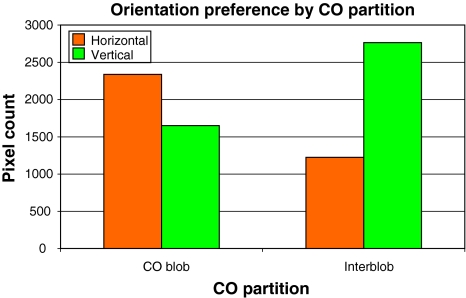
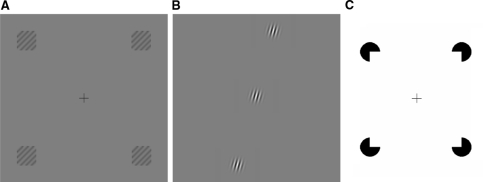
We review the evidence of long-range contextual modulation in V1. Populations of neurons in V1 are activated by a wide variety of stimuli outside of their classical receptive fields (RF), well beyond their surround region. These effects generally involve extra-RF features with an orientation component. The population mapping of orientation preferences to the upper layers of V1 is well understood, as far as the classical RF properties are concerned, and involves organization into pinwheel-like structures. We introduce a novel hypothesis regarding the organization of V1's contextual response. We show that RF and extra-RF orientation preferences are mapped in related ways. Orientation pinwheels are the foci of both types of features. The mapping of contextual features onto the orientation pinwheel has a form that recapitulates the organization of the visual field: an iso-orientation patch within the pinwheel also responds to extra-RF stimuli of the same orientation. We hypothesize that the same form of mapping applies to other stimulus properties that are mapped out in V1, such as colour and contrast selectivity. A specific consequence is that fovea-like properties will be mapped in a systematic way to orientation pinwheels. We review the evidence that cytochrome oxidase blobs comprise the foci of this contextual remapping for colour and low contrasts. Neurodynamics and motion in the visual field are argued to play an important role in the shaping and maintenance of this type of mapping in V1.


Figures

Fig. 1
Fig. 1
Tiling of orientation pinwheels. a The variable orientation preference has a range between 0 and π, and is mapped by Eq. 1 onto a circle, with range 0–2π. The circle represents an orientation pinwheel. Orientation pinwheels can be regarded as the basic components of the orientation preference map, as is schematically represented here by their jigsaw puzzle tiling. b Results from a simple algorithm for generating orientation pinwheel tiling. Starting from the central pinwheel tile shown in (a), rows of tiles are added that are reflected about the vertical axis every other row; columns are added that are reflected about the horizontal axis every other column (only the centre nine tiles are shown). This tiling results in a saddle point pattern at each four-way junction of tiles (left). At a saddle point, the orientation preference increases with distance from the saddle point along one border direction (e.g. horizontal) and decreases with distance along the other border direction (e.g. vertical). The saddle-point pattern can be modified by shifting every second row of tiles to the left or right by one tile. This operation results in linear zones at tile borders (right). Here the orientation preference changes continuously along the vertical border. c Simulation of fluid tiling of orientation pinwheels (adapted from Wright et al. 2006). This simulation allows the polar angle of the pinwheel’s coordinate system to vary in phase from tile to tile. A regular spacing of pinwheels is imposed, resulting in a regular spacing of singularities (the pinwheel centres), seen most clearly here in the right-hand column. The fluid interactions at tile borders provide for a variety of further topological features, including saddle-points and ‘border’ singularities. This figure shows that a tessellation of orientation pinwheels need not result in a rigidly tiled orientation preference map. The sign of the singularity (direction of change of orientation preference about the singularity) in each tile is shown by a ‘+’ or ‘−’ sign. Analysis of the signs of singularities shows that saddle-points and linear zones generally arise at the borders of tiles containing two odd and two even singularities. ‘Border’ singularities are marked with circles. In each case it can be seen that these arise at tile borders where three or more tiles have singularities of the same sign. ‘Border’ singularities arise where local map borders cannot be resolved as a smooth transition in the orientation preference gradient
Fig. 2
Fig. 2
Examples of stimuli used to measure contextual modulation in the primary visual cortex: a A circular high-contrast grating displayed on a mean-luminance background used in surround inhibition experiments (e.g. Levitt and Lund 2002). b A wide-field grating (e.g. Vanduffel et al. 2002). c Artificial scotoma (Fiorani et al. 1992): long, drifting lines (black) can activate a V1 neuron even when the RF of that neuron is covered by a mask the size of which is many times that of the RF. dCurved lines used in a curve tracing experiment (Roelfsema et al. ; Khayat et al. 2004a); a monkey is trained to fixate to the end-point of a curve, which the animal then ‘traces’ with a series of saccades. Prior to the saccades, neurons with RF along the attended line show elevated levels of activity compared to a second, distracter curve. e Texture defined boundaries (e.g. Lee et al. 1998): neurons in V1 show an orientation specific response to second-order edges. These second-order edges can be defined by a variety of cues, including a change in orientation of first-order texture elements. f Distal colour patches (Wachtler et al. 2003): the RF response to a colour patch can be modified by colour patches placed in distal positions. The fixation point is shown with a cross, and the middle colour patch is placed in the RF of the measured neuron
Fig. 3
Fig. 3
Schematic illustration of long-range connectivity patterns in the upper layers of the tree shrew. The square in the centre represents an orientation preference pinwheel; two black stars indicate injection sites of retrograde tracer. Neurons at the injection sites with orientation preference ϕ1 (red zone) or ϕ2 (blue zone) receive connections from neurons of similar orientation preference, indicated by the red and blue connectivity lines, respectively. In the tree shrew, these long range intrinsic connections can traverse the entire extent of V1. They form elongated patterns that match the orientation of elongated stimuli projected onto V1. The stimulus orientations Θ1 or Θ2 are consistent with the orientation preference at the site of injection. Thus the local field of orientation preference, ϕ, in the form of an orientation pinwheel, recapitulates the pattern of global input, Θ, which projects into the pinwheel
Fig. 4
Fig. 4
Relationship between CO blobs and DG uptake in Layer 3 of V1 (adapted from Tootell et al. 1988a). There is a large degree of overlap (yellow) between CO blobs (red) and DG uptake (green). Blood vessel artefacts are shown with blue arrows, and boundaries of a tear in the tissue are indicated by parallel blue lines. The animal was stimulated with low-contrast (8%) oriented lines of all orientations, out to 5° eccentricity. This created a crescent shaped region of cortex that was not exposed to the stimulus via direct, retinotopically organized inputs (above the boundary indicated by a white line). Within this region, the uptake of DG is faint. However, signal enhancement of the DG label uptake indicates the same overall pattern of overlap with CO blobs. Low-contrast gratings induce neuronal activity within CO blobs in regions of V1 not directly driven by stimulus activity. The scale bar at bottom right is 5 mm
Fig. 5
Fig. 5
Signals from the visuotopic field provide long-range contextual modulation of local map activity. Left Two extended texture elements are projected onto the retina. The grey-scale region indicates a retinal property that decreases monotically with eccentricity (i.e. a fovea-like property). Middle Long-range contextual information is projected onto a local map. Right The grey-scale region indicates populations of neurons with properties that are fovea-like; boxes indicate activated RFs of two orientation-selective neurons. Features that are spatially and temporally contiguous in the visuotopic field tend to be stored in neighbouring locations of the local map
Fig. 6
Fig. 6
Visuotopic mapping of global inputs onto a local map according to Eqs. 4 and 5 (adapted from Alexander et al. 2004). Left Visuotopic coordinate system. The black dot indicates the origin, which is at the centre of the fovea. Greyscale indicates a retinal property that decreases monotically with eccentricity (i.e. a fovea-like property). The coloured lines indicate a set of rays that pass through a point in the visual field, pG. Right The local map situated at the retinotopic coordinate pG. The black dot indicates the origin of the coordinate system of this local map, which corresponds to the orientation singularity. The mapping given in Eq. 4 has the primary effect of doubling the angles of the rays in the visual field, so that the range 2π of stimulus orientations maps to the range π of orientation preferences. The position of the CO blob centre is indicated by pb; the maximum of the fovea-like property in the local map
Fig. 7
Fig. 7
Tiling of response properties across the surface of V1 (adapted from Alexander et al. ; original imaging data from Bartfeld and Grinvald 1992). Circles indicate peaks in CO staining density, stars are pinwheel singularities. Grey lines either represent (a) ocular dominance borders or (b) run orthogonally to them, bisecting those points on the ocular dominance borders where orientation preference reverses direction. Each of the squares contains approximately one circle and one star and thus matches our definition of a local map. This demarcation of local maps is possible because a number of features have the same approximate periodicity
Fig. 8
Fig. 8
LGM Orientation and singularity predictions for macaque V1. The transformation of visual field coordinates (left) to local map coordinates (right) is given by Eq. 4. The small images in-between show the retinotopic map of V1. Upper half The red dot in the retinotopic map of V1 indicates a site of imaging near the horizontal meridian in the parafoveal/peripheral region. Here, the prediction is that singularities will tend not to coincide with CO blobs centres and that the orientation preference in the CO blob centres will change systematically depending on the polar angle of the imaging site. In this case, a horizontal line passes through the site of imaging, pG, and through the fovea (left-hand side of figure). This means that horizontal orientation preferences and fovea-like properties will be co-axial in the local map (right-hand side of figure). Lower half The red dot on the retinotopic map of V1 indicates a site of imaging in the foveal region. Imaging the foveal region of V1 will show singularities and CO blobs tending to coincide. In this case, all lines that pass through the site of imaging, pG, also pass through the fovea (left-hand side of figure). This means that singularities and fovea-like properties will be co-axial in the local map (right-hand side of figure)
Fig. 9
Fig. 9
Superimposed images of CO blobs and orientation preferences from the horizontal meridian in V1, at about 6° eccentricity; adapted from Vanduffel et al. (2002). The majority of CO blobs (black boundaries) overlie regions of horizontal orientation preference (orange) and stay away from regions of vertical orientation preference (green)
Fig. 10
Fig. 10
Numerical analysis of the Vanduffel et al. (2002) data. The map of CO staining was partitioned into two equally sized regions: high versus low CO. There is a strong preference in high-CO regions for horizontal orientations and for vertical orientations in low-CO regions
Fig. 11
Fig. 11
Global configurations of local stimulus components. a Radial bias effect: grating patches placed in the periphery of the visual field elicit a larger BOLD response when they are radially oriented compared to when they are tangentially oriented (Sasaki et al. 2006). In this case, the top-right and bottom-left patches elicit a greater response because the gratings within each patch are oriented diagonally top-right to bottom-left. The BOLD response is smaller where the global orientation of the patches does not agree with the local grating orientation, such as the top-left and bottom-right patches in this figure. b Radially aligned grating patches: an excitatory contextual response is more likely to be elicited in cat V1 neurons when the distant Gabor patches are aligned in a radial fashion with the RF patch (Mizobe et al. 2001). c Illusory contours: when subjects are trained to discriminate variants of Kanizsa squares, V1’s BOLD response increases as a result of the training (Maertens and Pollmann 2005)

References

    1. Adams DL, Horton JC. A precise retinotopic map of primate striate cortex generated from the representation of angioscotomas. J Neurosci. 2003;23(9):3771–3789. - PMC - PubMed
    1. Alexander DM, Wright JJ. The maximum range and timing of excitatory contextual modulation in monkey primary visual cortex. Vis Neurosci. 2006;23(5):721–728. doi: 10.1017/S0952523806230049. - DOI - PubMed
    1. Alexander DM, Bourke PD, Sheridan P, Konstandatos O, Wright JJ (1998) Emergent symmetry of local and global maps in the primary visual cortex: self-organization of orientation preference. Complexity International 6: http://www.complexity.org.au/ci/vol06/alexander/alexander.html
    1. Alexander DM, Bourke PD, Sheridan P, Konstandatos O, Wright JJ. Intrinsic connections in tree shrew V1 imply a global to local mapping. Vision Res. 2004;44(9):857–876. doi: 10.1016/j.visres.2003.11.009. - DOI - PubMed
    1. Allman JM, Miezin FM, McGuinness E. Stimulus specific responses from beyond the classical receptive field: neurophysiological mechanisms for local-global comparisons in visual neurons. Annu Rev Neurosci. 1985;8:407–430. doi: 10.1146/annurev.ne.08.030185.002203. - DOI - PubMed