

Interaction between nitric oxide synthase inhibitor induced oscillations and the activation flow coupling response
- PMID: 19900416
- PMCID: PMC2789854
- DOI: 10.1016/j.brainres.2009.09.119
Interaction between nitric oxide synthase inhibitor induced oscillations and the activation flow coupling response
Abstract
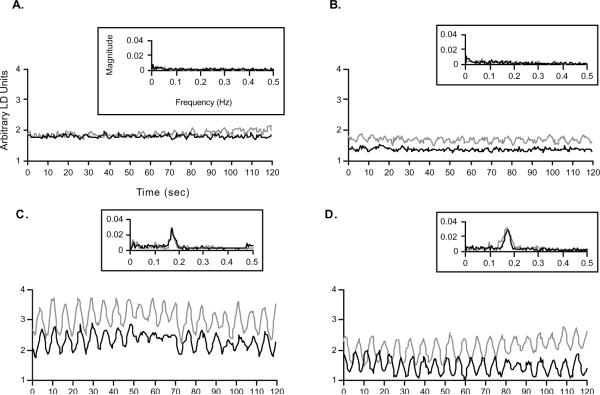
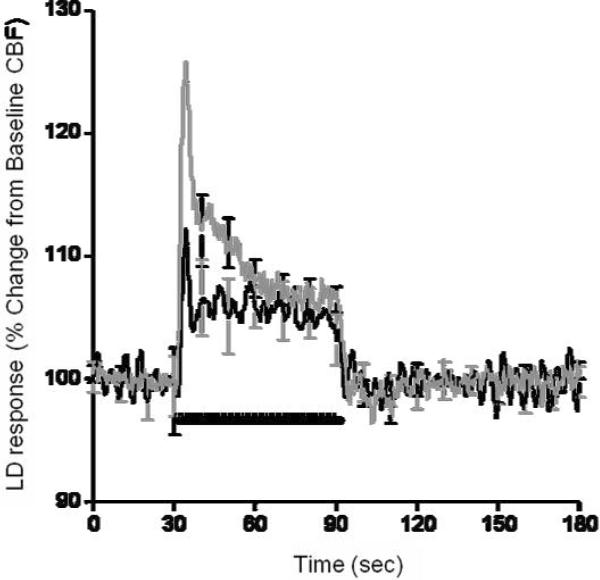
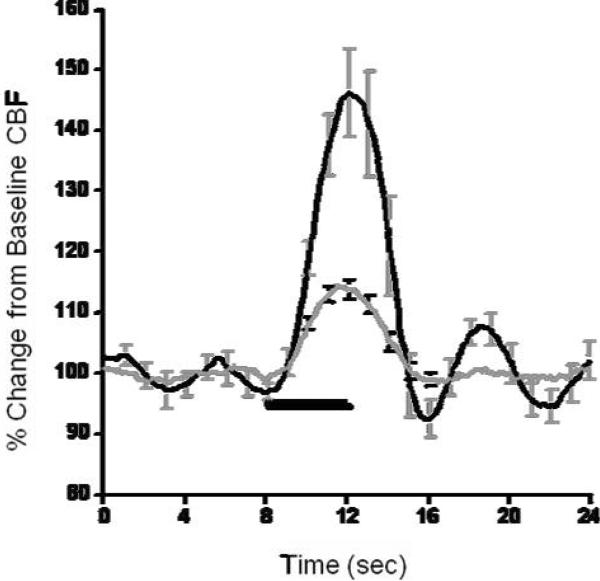
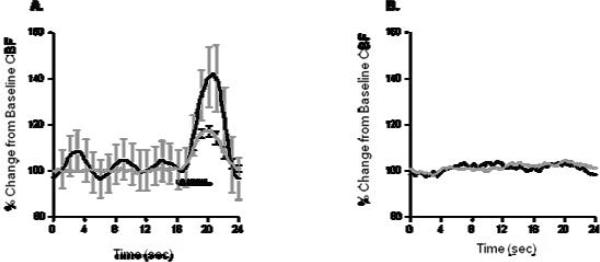
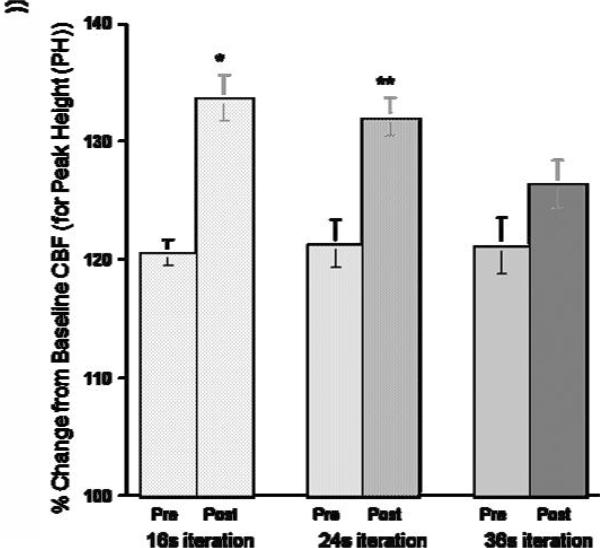
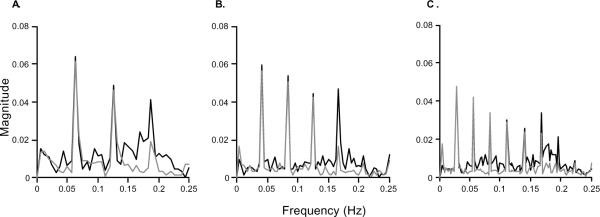
The role of nitric oxide (NO) in the activation-flow coupling (AFC) response to periodic electrical forepaw stimulation was investigated using signal averaged laser Doppler (LD) flowmetry. LD measures of calculated cerebral blood flow (CBF) were obtained both prior and after intra-peritoneal administration of the non-selective nitric oxide synthase (NOS) inhibitor, N(G)-nitro-L-arginine (L-NNA) (40 mg/kg). Characteristic baseline low frequency vasomotion oscillations (0.17 Hz) were observed after L-NNA administration. These LD(CBF) oscillations were synchronous within but not between hemispheres. L-NNA reduced the magnitude of the AFC response (p<0.05) for longer stimuli (1 min) with longer inter-stimulus intervals (2 min). In contrast, the magnitude of the AFC response for short duration stimuli (4 s) with short inter-stimulus intervals (20 s) was augmented (p<0.05) after L-NNA. An interaction occurred between L-NNA induced vasomotion oscillations and the AFC response with the greatest increase occurring at the stimulus harmonic closest to the oscillatory frequency. Nitric oxide may therefore modulate the effects of other vasodilators involved in vasomotion oscillations and the AFC response.
Figures
Similar articles
-
Nitric oxide: a modulator, but not a mediator, of neurovascular coupling in rat somatosensory cortex.Am J Physiol. 1999 Aug;277(2):H799-811. doi: 10.1152/ajpheart.1999.277.2.H799. Am J Physiol. 1999. PMID: 10444508
-
Cortical NOS inhibition raises the lower limit of cerebral blood flow-arterial pressure autoregulation.Am J Physiol. 1999 Apr;276(4):H1253-62. doi: 10.1152/ajpheart.1999.276.4.H1253. Am J Physiol. 1999. PMID: 10199850
-
Permissive and obligatory roles of NO in cerebrovascular responses to hypercapnia and acetylcholine.Am J Physiol. 1996 Oct;271(4 Pt 2):R990-1001. doi: 10.1152/ajpregu.1996.271.4.R990. Am J Physiol. 1996. PMID: 8897992
-
Roles of nitric oxide as a vasodilator in neurovascular coupling of mouse somatosensory cortex.Neurosci Res. 2007 Oct;59(2):160-71. doi: 10.1016/j.neures.2007.06.1469. Epub 2007 Jun 22. Neurosci Res. 2007. PMID: 17655958
-
Relative contributions from neuronal and endothelial nitric oxide synthases to regional cerebral blood flow changes during forebrain ischemia in rats.Neuroreport. 2000 May 15;11(7):1549-53. Neuroreport. 2000. PMID: 10841375
Cited by
-
Nitric oxide is not responsible for initial sensory-induced neurovascular coupling response in the barrel cortex of lightly anesthetized mice.Neurophotonics. 2025 Jun;12(Suppl 2):S22802. doi: 10.1117/1.NPh.12.S2.S22802. Epub 2025 Jun 20. Neurophotonics. 2025. PMID: 40548064 Free PMC article.
-
The decoupling between hemodynamic parameters and neural activity implies a complex origin of spontaneous brain oscillations.Front Comput Neurosci. 2023 Jul 31;17:1214793. doi: 10.3389/fncom.2023.1214793. eCollection 2023. Front Comput Neurosci. 2023. PMID: 37583895 Free PMC article.
-
Renal autoregulation in health and disease.Physiol Rev. 2015 Apr;95(2):405-511. doi: 10.1152/physrev.00042.2012. Physiol Rev. 2015. PMID: 25834230 Free PMC article. Review.
-
Direct, intraoperative observation of ~0.1 Hz hemodynamic oscillations in awake human cortex: implications for fMRI.Neuroimage. 2014 Feb 15;87:323-31. doi: 10.1016/j.neuroimage.2013.10.044. Epub 2013 Nov 1. Neuroimage. 2014. PMID: 24185013 Free PMC article.
References
-
- Adachi K, Takahashi S, Melzer P, Campos KL, Nelson T, Kennedy C, Sokoloff L. Increases in local cerebral blood flow associated with somatosensory activation are not mediated by NO. Am J Physiol. 1994;267:H2155–62. - PubMed
-
- Adachi T, Inanami O, Sato A. Nitric oxide (NO) is involved in increased cerebral cortical blood flow following stimulation of the nucleus basalis of Meynert in anesthetized rats. Neurosci Lett. 1992;139:201–4. - PubMed
-
- Ances BM, Detre JA, Takahashi K, Greenberg JH. Transcranial laser doppler mapping of activation flow coupling of the rat somatosensory cortex. Neurosci Lett. 1998;257:25–8. - PubMed
-
- Ayata C, Ma J, Meng W, Huang P, Moskowitz MA. L-NA-sensitive rCBF augmentation during vibrissal stimulation in type III nitric oxide synthase mutant mice. J Cereb Blood Flow Metab. 1996;16:539–41. - PubMed
-
- Baselli G, Porta A, Pagani M. Coupling arterial windkessel with peripheral vasomotion: modeling the effects on low-frequency oscillations. IEEE Trans Biomed Eng. 2006;53:53–64. - PubMed
Publication types
MeSH terms
Substances
Grants and funding
LinkOut - more resources
Full Text Sources
Research Materials
