

Effects of stimulus size and spatial organization on pigeons' conditional same-different discrimination
- PMID: 19900511
- PMCID: PMC2931576
- DOI: 10.1016/j.beproc.2009.10.007
Effects of stimulus size and spatial organization on pigeons' conditional same-different discrimination
Abstract
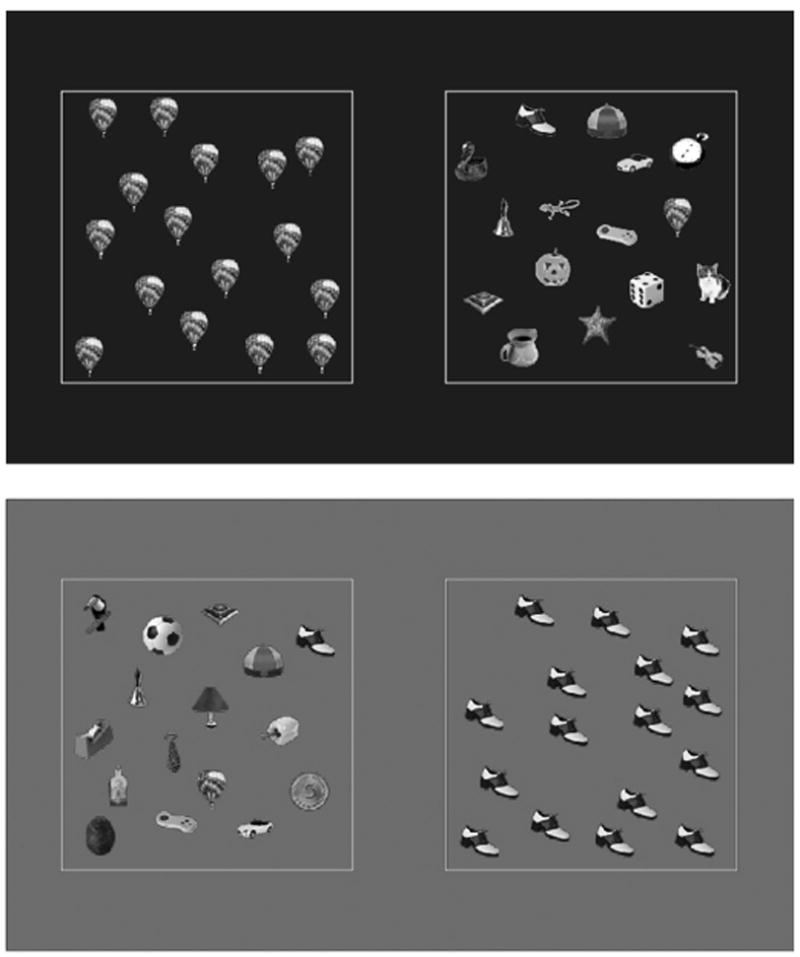
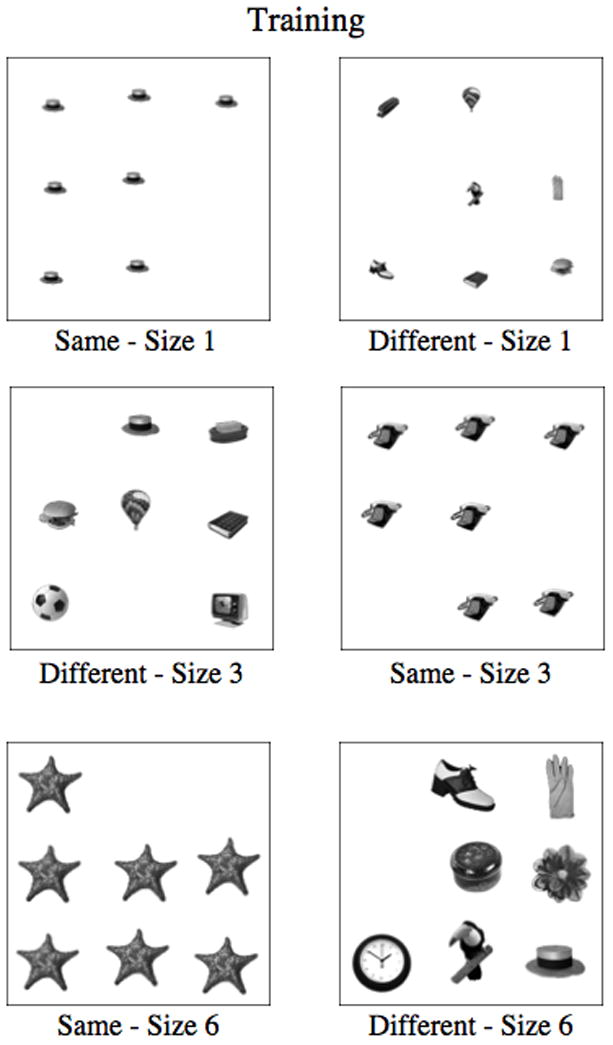
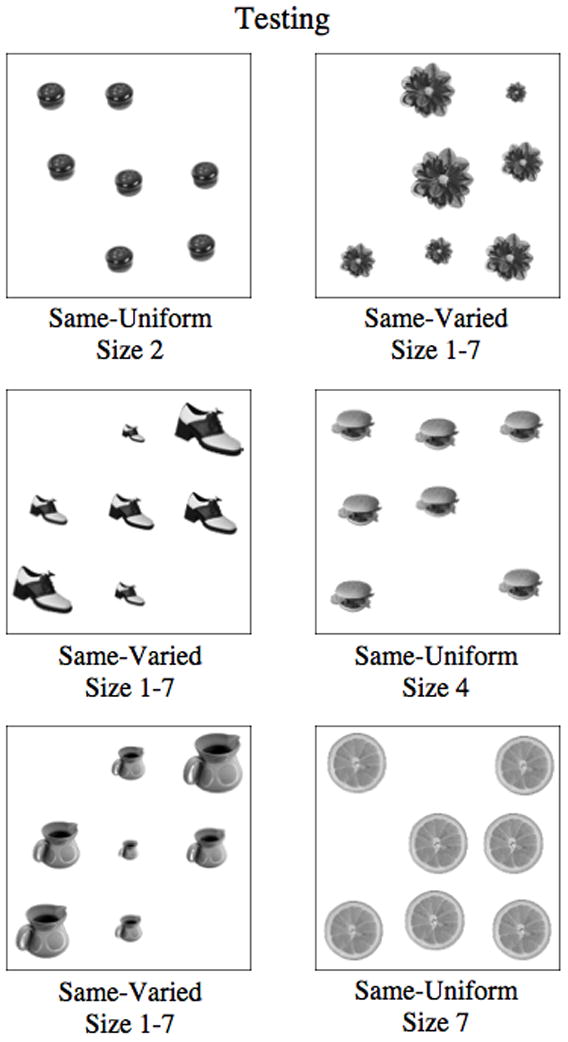
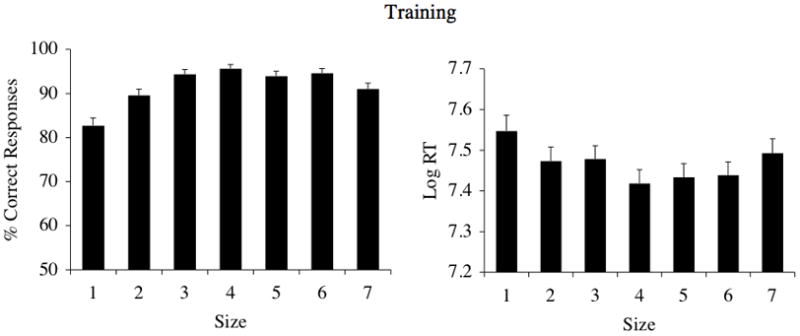
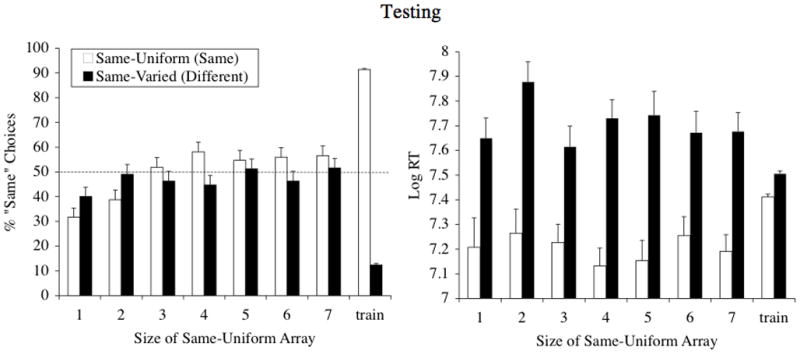
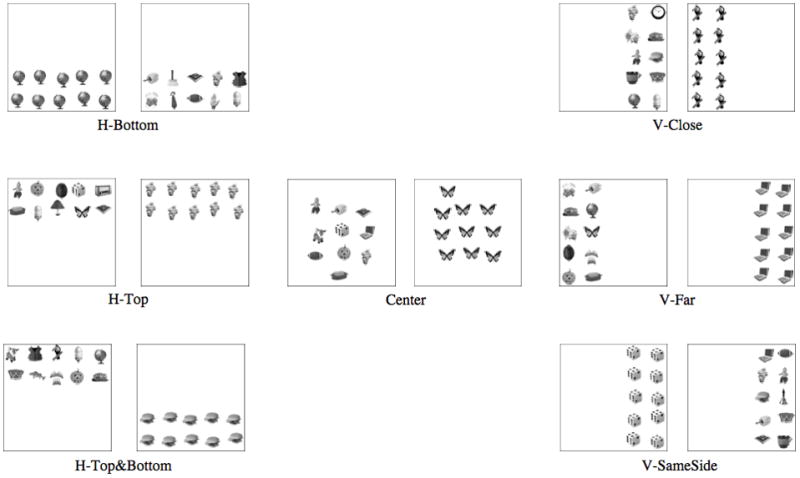
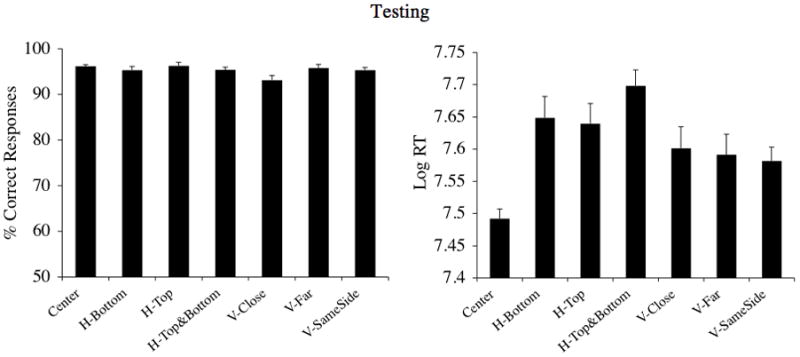
In two experiments, we explored the effects of varying the size and the spatial organization of the stimuli in multi-item arrays on pigeons' same-different discrimination behavior. The birds had previously learned to discriminate a simultaneously presented array of 16 identical (Same) visual items from an array of 16 nonidentical (Different) visual items, when the correct choice was conditional on the presence of another cue: the color of the background (Castro et al., in press). In Experiment 1, we trained pigeons with 7-item arrays and then tested them with arrays containing the same item, but in a variety of sizes. In Experiment 2, we tested the birds with the items grouped in novel locations: the top, the bottom, the left, or the right portions of the display area, which generated different vertical and horizontal alignments. Accuracy scores revealed virtually perfect stimulus generalization across various item sizes and spatial organizations. Reaction times revealed that the birds perceived different sizes of a single icon as the same stimulus (Experiment 1) and that the birds processed vertical arrangements faster than horizontal arrangements (Experiment 2). These results suggest that the pigeons noticed both physical and spatial changes in the stimuli (as shown by their reaction times), but that these changes did not disrupt the birds' discriminating the sameness or differentness of the multi-item arrays (as shown by their accuracy scores).
Copyright 2009 Elsevier B.V. All rights reserved.
Figures
References
-
- Castro L, Kennedy PL, Wasserman EA. Conditional same-different discrimination by pigeons: Acquisition and generalization to novel and few-item displays. Journal of Experimental Psychology: Animal Behavior Processes in press. - PubMed
-
- Castro L, Young ME, Wasserman EA. Effects of number of items and visual display variability on same-different discrimination behavior. Memory and Cognition. 2006;34:1689–1703. - PubMed
-
- Cook RG, Wasserman EA. Relational discrimination learning in pigeons. In: Wasserman EA, Zentall TR, editors. Comparative cognition: Experimental explorations of animal intelligence. New York: Oxford University Press; 2006.
-
- Descartes R. In: Discourse on the method. Heffeman G, translator and editor. Notre Dame, IN: University of Notre Dame Press; 1994. Original work published 1637.
-
- Feng C, Jiang Y, He S. Horizontal and vertical asymmetry in visual spatial crowding effects. Journal of Vision. 2007;7:1–10. - PubMed
MeSH terms
Grants and funding
LinkOut - more resources
Full Text Sources
