. 2010 Feb;43(2):188-200.
doi: 10.1016/j.mcn.2009.10.009. Epub 2009 Nov 10.

Postsynaptic PDLIM5/Enigma Homolog binds SPAR and causes dendritic spine shrinkage

Affiliations

Postsynaptic PDLIM5/Enigma Homolog binds SPAR and causes dendritic spine shrinkage

Scott Herrick et al. Mol Cell Neurosci. 2010 Feb.

Abstract

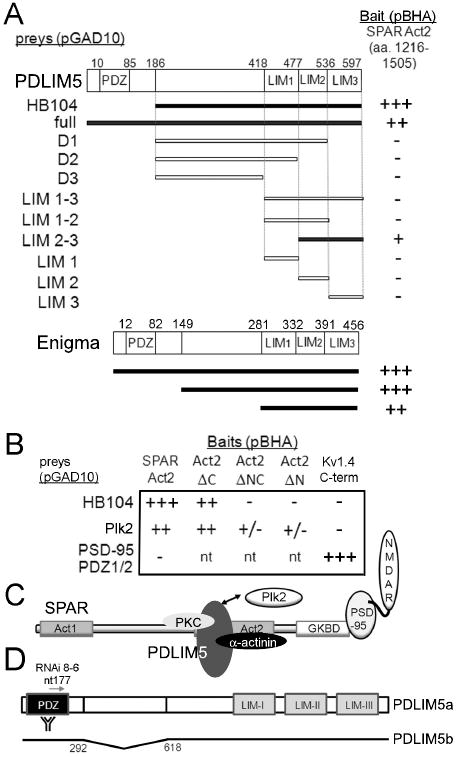
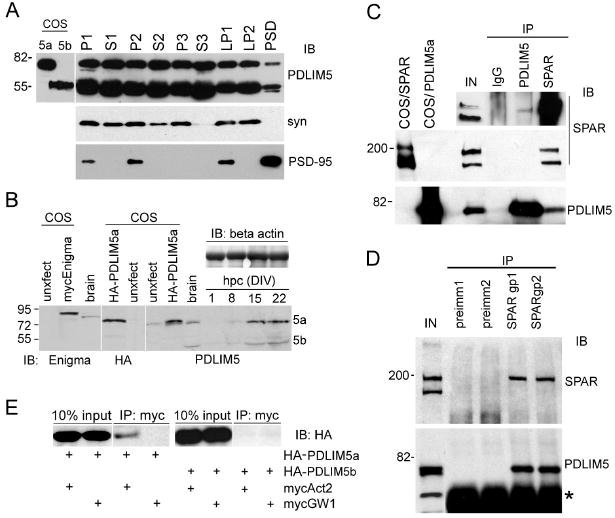
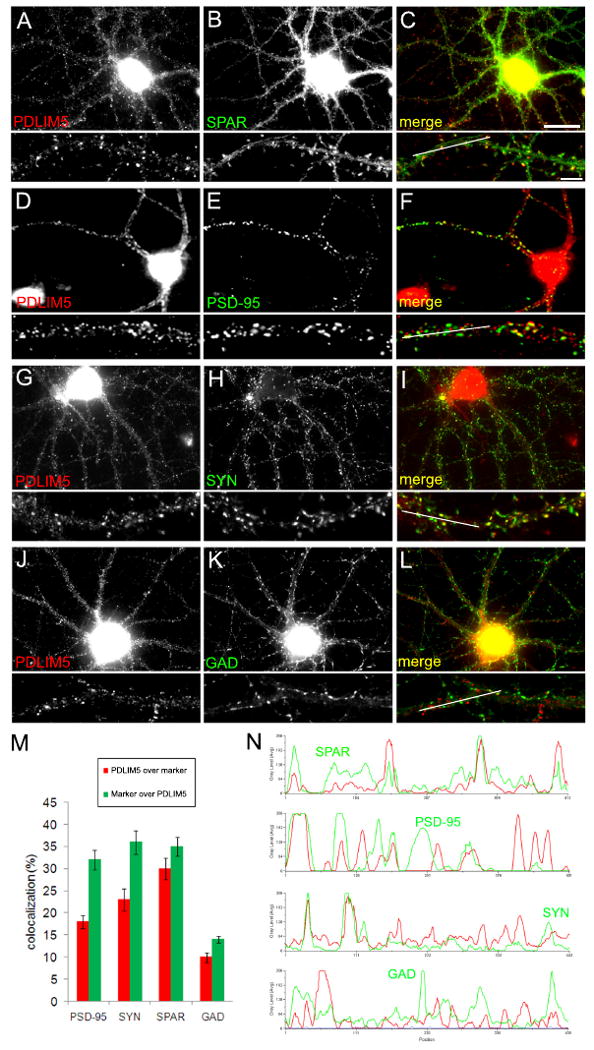
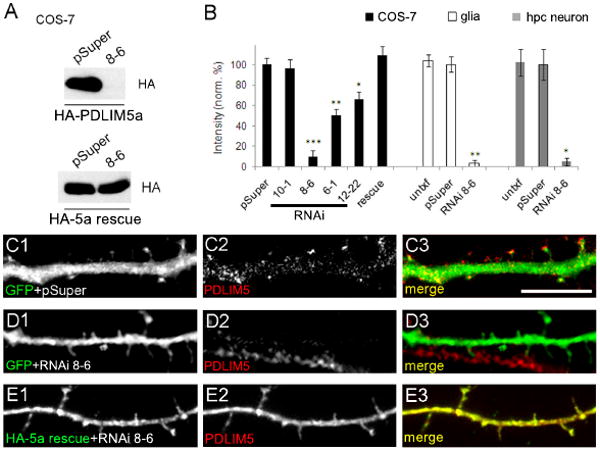
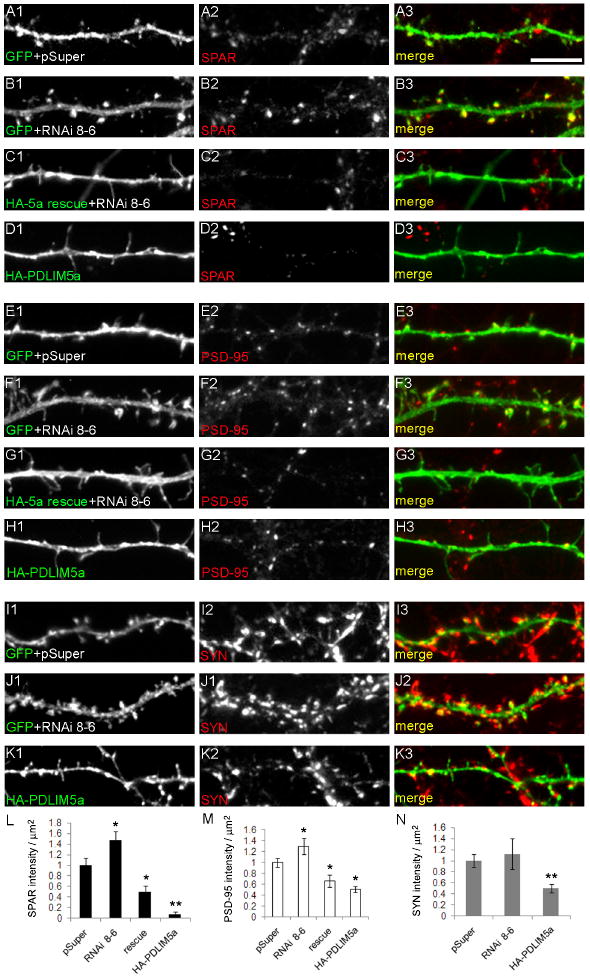
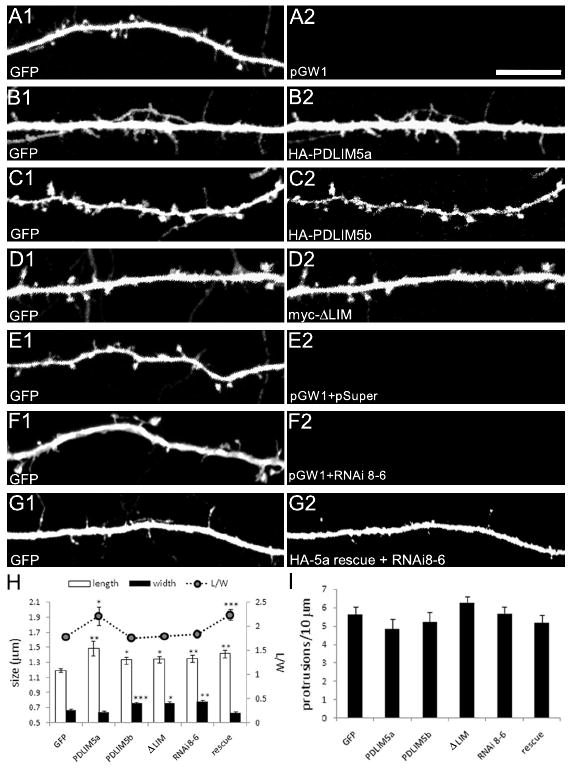
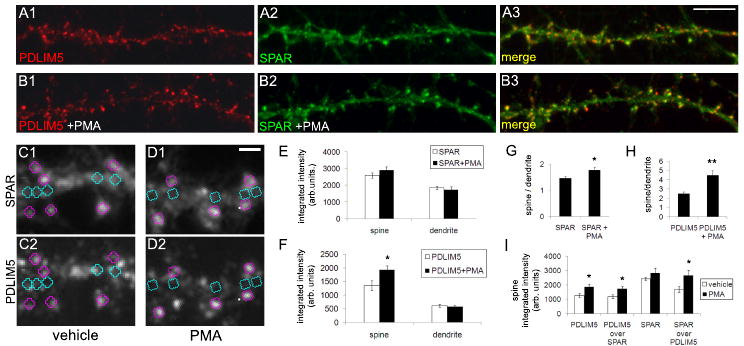
Dendritic spine morphology is thought to play important roles in synaptic development and plasticity, and morphological derangements in spines are correlated with several neurological disorders. Here, we identified an interaction between Spine-Associated RapGAP (SPAR), a postsynaptic protein that reorganizes actin cytoskeleton and drives dendritic spine head growth, and PDLIM5/Enigma Homolog (ENH), a PDZ-LIM (postsynaptic density-95/Discs large/zona occludens 1-Lin11/Isl-1/Mec3) family member. PDLIM5 has been implicated in susceptibility to bipolar disorder, major depression, and schizophrenia, but its function in neurological disease is poorly understood. We show that PDLIM5 is present in the postsynaptic density, where it promotes decreased dendritic spine head size and longer, filopodia-like morphology. Conversely, RNA interference against PDLIM5 or loss of PDLIM5 interaction with SPAR caused increased spine head diameter. Furthermore, PKC activation promoted delivery of PDLIM5 into dendritic spines and increased its spine colocalization with SPAR. These data reveal new postsynaptic functions for PDLIM5 in shrinkage of dendritic spines that may be relevant to its association with psychiatric illness.


Figures

Figure 1
Figure 1. Identification of PDLIM5 as a SPAR interacting protein
(A) Yeast 2-hybrid screen (Y2H) was performed using as bait SPAR Act2 domain in vector pBHA. Interaction strength for all Y2H assays was scored in terms of β-gal activity (+++, 0-15 min; ++, 15-30 min; +, 30 min to 2 hrs; +/-, 2 hrs to overnight; -, not detected; nt, not tested). Region of PDLIM5 encoded by positive clone HB104 and deletion analysis of PDLIM5 are shown below schematic diagram of PDLIM5 primary structure. Bottom, regions of Enigma tested in Y2H assay are shown below schematic diagram of Enigma primary structure. Numbers shown are amino acid residues; interacting clones are highlighted in black. (B) Deletion analysis of SPAR Act2. Domain constructs lacking the N terminal portion of Act2 (ΔC), the C terminal portion (ΔN), or both (ΔNC) were assayed by Y2H for interaction with PDLIM5 clone HB104. Plk2 in vector pGAD10 is used as a positive control for interaction with Act2, and PSD-95 PDZ1/2 domain in pGAD10 is used as negative control. Kv1.4 C-terminus is used as a positive control for PSD-95 PDZ1/2 interaction. (C) Schematic of SPAR interactions. SPAR domains shown are Act1 and 2, actin-associated domains 1 and 2; GKBD, guanylate kinase binding domain that interacts with the guanylate kinase-like domain of PSD-95. NMDAR, NMDA receptors. Double arrow denotes PDLIM5 and Plk2 interaction with the same region of SPAR. (D) Schematic of PDLIM5 reagents used in the study. PDLIM5a (full-length) and PDLIM5b (deletion of nt 292-618), position of RNAi 8-6, and PDZ region used as immunogen for PDLIM5 rabbit antibodies are shown.
Figure 2
Figure 2. Biochemical association of PDLIM5 with SPAR
(A) Adult rat brains were homogenized, subjected to biochemical fractionation, and immunoblotted for PDLIM5 (GU8 rabbit antibodies), synaptophysin (syn), or PSD-95 as indicated. P1, crude pellet; P2, crude synaptosomes; P3, light membrane; S3, cytosolic; LP1, synaptic membrane; LP2, synaptic vesicle; PSD, postsynaptic density. PDLIM5 co-fractionated with both pre- and postsynaptic markers. COS-7 lysates expressing recombinant PDLIM5a or PDLIM5b are included (left lanes) to show the expected sizes of isoforms. (B) Cultured hippocampal neuron lysates (hpc) were harvested at various days in vitro (DIV) and immunoblotted for PDLIM5 (a and b isoforms are indicated). Beta actin levels are shown as loading control. To show the expected size of PDLIM5 and the specificity of antibodies, whole brain lysates or COS-7 transfected cell lysates of myc-Enigma or HA-PDLIM5a are included (left lanes as indicated) and immunoblotted with antibodies shown at bottom of blots. Note recombinant myc-Enigma and HA-PDLIM5a migrate slightly higher than endogenous counterparts due to the epitope tag. Unxfect, untransfected. (C) Adult rat brain lysates were immunoprecipitated with antibodies against PDLIM5 (GU8 rabbit) or SPAR rabbit, or nonimmune rabbit IgG, and immunoblotted for endogenous SPAR and PDLIM5, as indicated. COS-7 lysates expressing recombinant SPAR or PDLIM5 are included (left lanes) to show the expected size of full length proteins. Inset at top shows a longer exposure of a SPAR western from a duplicate experiment showing weak but detectable SPAR coimmunoprecipitated with PDLIM5 antibodies. IN, 10% lysate used per IP (1% lysate for overexposed inset). (D) Rat brain lysates immunoprecipitated with two independent anti-SPAR guinea pig sera (gp1 and gp2), or preimmune sera from the same animals (preimm1 and preimm2). Precipitates were immunoblotted for SPAR or PDLIM5, as indicated. Asterisk represents IgG heavy chain. IN, 10% of input used per immunoprecipitation reaction. (E) COS-7 cells were transfected with myc-tagged Act2 domain, HA-tagged full-length PDLIM5a or PDLIM5b, or empty mycGW1 vector as indicated. Lysates were immunoprecipitated with myc agarose beads and immunoblotted with HA epitope antibodies. Input is shown demonstrating equal expression of PDLIM5 between conditions. All molecular weights shown in kilodaltons.
Figure 3
Figure 3. Colocalization of SPAR and PDLIM5 in COS-7 cells
(A-C) COS-7 cells were singly transfected for SPAR, PDLIM5a, or SPAR ΔAct2 as indicated and immunostained for the exogenous protein. Arrows in (B) indicate examples of PDLIM5a enrichment at apparent membrane ruffles. (D) COS-7 cells doubly transfected with SPAR and PDLIM5a, and immunostained for SPAR (D1) or PDLIM5a (D2), with merged image shown in D3. Arrowheads, SPAR clusters that recruit PDLIM5. Arrow, example of PDLIM5 enrichment at membrane ruffle that does not recruit SPAR. (E) COS-7 cells doubly transfected with PDLIM5a and SPAR ΔAct2 and immunostained for SPAR (E1) or PDLIM5a (E2), with merged image shown in E3. (F) COS-7 cells doubly transfected with PDLIM5a and Act2 domain and immunostained for Act2 (F1) or PDLIM5a (F2), with merged image in F3. (G) COS-7 cells doubly transfected with PDLIM5b and SPAR and immunostained for SPAR (G1) or PDLIM5b (G2), with merged image in G3. Scale bar in (A), 5 μm.
Figure 4
Figure 4. Colocalization of PDLIM5 with pre- and postsynaptic elements of excitatory synapses
(A-L) Cultured hippocampal neurons at 19DIV were immunostained for endogenous PDLIM5 (GU8 rabbit antibodies, left panels) along with various synaptic markers (middle panels) as indicated, with merged images shown in right panels. Below each panel is a higher magnification view of a representative dendritic segment. White lines in merged dendrite images indicate regions used for linescan analysis in (N). Scale bar, 20 μm in (C), 5 μm for magnified dendrites. (M) Quantification of colocalization between PDLIM5 and synaptic markers PSD-95, synaptophysin (SYN), SPAR, or GAD. Data are means +/- SEM and are shown as percent colocalization of PDLIM5 with marker (red bars) or percent colocalization of marker with PDLIM5 (green bars). (N) Linescans showing representative overlap of PDLIM5 distribution (red lines) with SPAR, PSD-95, SYN, or GAD as indicated (green lines).
Figure 5
Figure 5. Generation of PDLIM5 knockdown and rescue constructs
(A) COS-7 cells were cotransfected with HA-tagged PDLIM5a (upper blot) or HA-5a rescue construct (lower blot) and either pSuper vector or RNAi 8-6 as indicated. Total protein lysates were immunostained with HA antibodies. Results shown are representative of three independent experiments. (B) Quantification of PDLIM5 RNAi results against exogenous PDLIM5a transfected in COS-7 cells (black bars, n=3 western blots) or against endogenous PDLIM5 in glia (white bars, n=12 cells) and in neurons (gray bars, n=12 cells) as indicated. Untxf = untransfected neighboring cells used as internal negative control. Data are normalized to pSuper control and shown as mean +/- SEM. ***p<0.001, **p<0.01, one-way ANOVA with Tukey's post hoc test (COS-7 data) or Student's t-test (glial and hippocampal data). (C-E) Hippocampal neurons co-transfected with pEGFP and pSuper control (C), with pEGFP and PDLIM5 RNAi 8-6 (D), or with HA-5a rescue and RNAi 8-6 (E) were immunostained for GFP or HA antibodies (left panels) to identify transfected cells and for PDLIM5 in middle panels (C2, D2, E2). Merged images are shown in right panels. Scale bar, 5 μm.
Figure 6
Figure 6. Effect of PDLIM5 knockdown on synaptic protein expression
(A-K) Hippocampal neurons co-transfected with pEGFP and pSuper control (A, E, I), with pEGFP and PDLIM5 RNAi 8-6 (B, F, J), with HA-5a rescue and RNAi 8-6 (C, G), or with HA-PDLIM5a (D, H, K) were immunostained for GFP or HA as indicated (left panels) to identify transfected cells and for SPAR (A2-D2), PSD-95 (E2-H2), or synaptophysin (SYN; I2-K2) in middle panels. Merged images are shown in right panels. Scale bar, 5 μm. (L, M, N) Quantification of data in A-K. Data are shown as mean +/- SEM. **p<0.01, *p<0.05, one-way ANOVA with Tukey's post hoc test.
Figure 7
Figure 7. Role of PDLIM5 in spine morphogenesis
(A-G) Cultured hippocampal neurons were transfected with constructs as indicated and analyzed by confocal microscopy. In all cases, GFP (left panels) was included to visualize neuronal morphology and was used for quantification of spines. All cotransfected proteins were immunostained to verify expression (right panels). Scale bar, 10 μm. (H) Quantification of spine length and width (left axis) and ratio of length to width (L/W, right axis) for indicated conditions. ***p<0.001, **p<0.01, *p<0.05; one-way ANOVA with Tukey's post hoc test. (I) Quantification of linear density of dendritic protrusions for conditions as indicated.
Figure 8
Figure 8. PKC activation drives PDLIM5 to dendritic spines
Cultured hippocampal neurons (27DIV) were incubated with (A) vehicle (DMSO) or (B) phorbol 12-myristate 13-acetate (PMA, 1 μM) for 10 min, then fixed and immunostained for PDLIM5 (A1, B1) or SPAR (A2, B2), with merged image shown at right (A3, B3). Scale bar in A3, 5 μm. (C-D) Integrated intensities of immunofluorescence signals for vehicle (C) and PMA treated neurons (D) was measured in 0.5 μm diameter circular regions in dendritic spines (pink) and adjacent dendrite (teal) of SPAR images (C1, D1) and regions of interest then transferred to corresponding PDLIM5 images (C2, D2) for intensity and colocalization measurement. Scale bar in D1, 1 μm. (E-F) Quantification of integrated intensity of (E) SPAR and (F) PDLIM5 in dendritic spines and dendritic shaft from data in (A, B). (G-H) Quantification of ratio of integrated intensity in dendritic spines vs. dendritic shaft for (G) SPAR and (H) PDLIM5 from data in (A, B). (I) Quantification of integrated intensity of PDLIM5 and SPAR in dendritic spines under conditions as indicated. PDLIM5 over SPAR and SPAR over PDLIM5 represent integrated intensity of colocalized pixels. *p<0.05, **p<0.01.

Similar articles

Cited by

References

    1. Abeliovich A, Chen C, Goda Y, Silva AJ, Stevens CF, Tonegawa S. Modified hippocampal long-term potentiation in PKC gamma-mutant mice. Cell. 1993;75:1253–1262. - PubMed
    1. Arinami T. Initial genome-wide scan for linkage with schizophrenia in the Japanese Schizophrenia Sib-Pair Linkage Group (JSSLG) families. Am J Med Genet B Neuropsychiatr Genet. 2003;120B:22–28. - PubMed
    1. Blackstone C, Murphy TH, Moss SJ, Baraban JM, Huganir RL. Cyclic AMP and synaptic activity-dependent phosphorylation of AMPA-preferring glutamate receptors. J Neurosci. 1994;14:7585–7593. - PMC - PubMed
    1. Blanpied TA, Ehlers MD. Microanatomy of dendritic spines: emerging principles of synaptic pathology in psychiatric and neurological disease. Biol Psychiatry. 2004;55:1121–1127. - PubMed
    1. Bourne J, Harris KM. Do thin spines learn to be mushroom spines that remember? Curr Opin Neurobiol. 2007;17:381–386. - PubMed

Publication types

MeSH terms