. 2010 Jan 15;285(3):2140-51.
doi: 10.1074/jbc.M109.015222. Epub 2009 Nov 9.

Facilitation of mitochondrial outer and inner membrane permeabilization and cell death in oxidative stress by a novel Bcl-2 homology 3 domain protein

Affiliations

Facilitation of mitochondrial outer and inner membrane permeabilization and cell death in oxidative stress by a novel Bcl-2 homology 3 domain protein

Andras Szigeti et al. J Biol Chem. .

Abstract

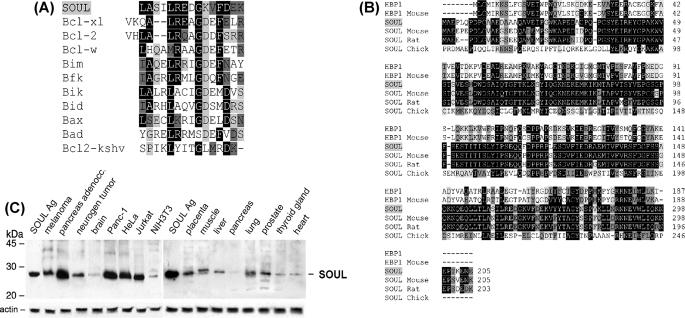
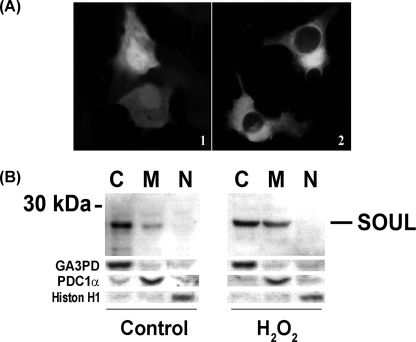
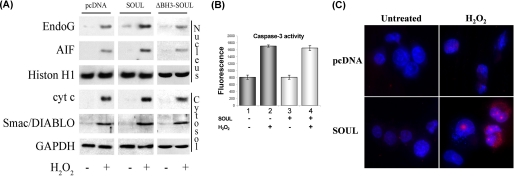
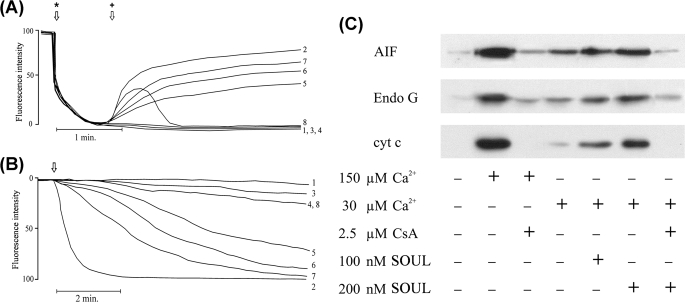
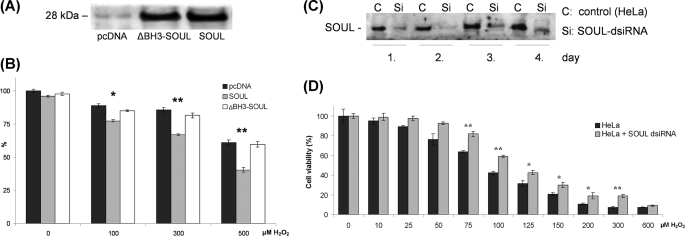
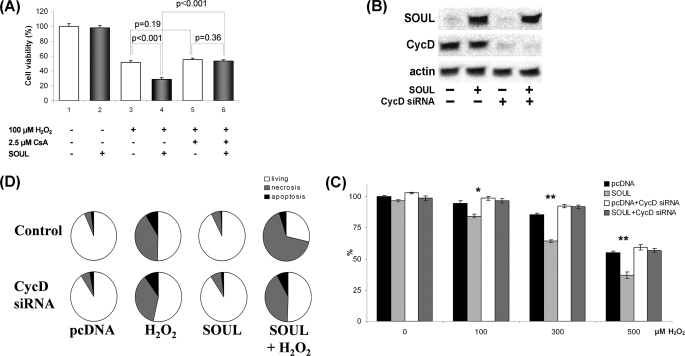
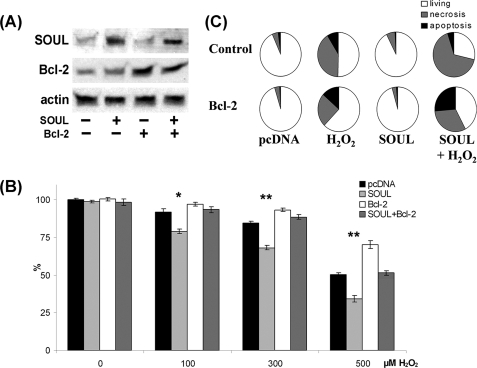
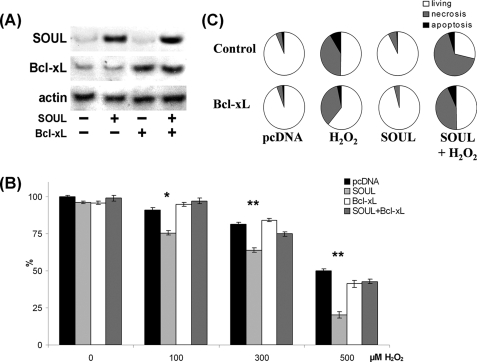
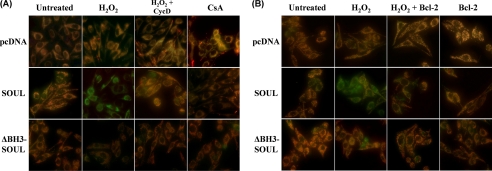
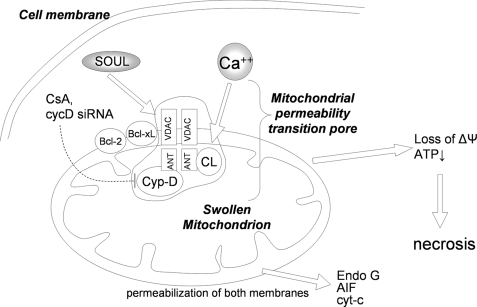
We identified a sequence homologous to the Bcl-2 homology 3 (BH3) domain of Bcl-2 proteins in SOUL. Tissues expressed the protein to different extents. It was predominantly located in the cytoplasm, although a fraction of SOUL was associated with the mitochondria that increased upon oxidative stress. Recombinant SOUL protein facilitated mitochondrial permeability transition and collapse of mitochondrial membrane potential (MMP) and facilitated the release of proapoptotic mitochondrial intermembrane proteins (PMIP) at low calcium and phosphate concentrations in a cyclosporine A-dependent manner in vitro in isolated mitochondria. Suppression of endogenous SOUL by diced small interfering RNA in HeLa cells increased their viability in oxidative stress. Overexpression of SOUL in NIH3T3 cells promoted hydrogen peroxide-induced cell death and stimulated the release of PMIP but did not enhance caspase-3 activation. Despite the release of PMIP, SOUL facilitated predominantly necrotic cell death, as revealed by annexin V and propidium iodide staining. This necrotic death could be the result of SOUL-facilitated collapse of MMP demonstrated by JC-1 fluorescence. Deletion of the putative BH3 domain sequence prevented all of these effects of SOUL. Suppression of cyclophilin D prevented these effects too, indicating that SOUL facilitated mitochondrial permeability transition in vivo. Overexpression of Bcl-2 and Bcl-x(L), which can counteract the mitochondria-permeabilizing effect of BH3 domain proteins, also prevented SOUL-facilitated collapse of MMP and cell death. These data indicate that SOUL can be a novel member of the BH3 domain-only proteins that cannot induce cell death alone but can facilitate both outer and inner mitochondrial membrane permeabilization and predominantly necrotic cell death in oxidative stress.


Figures

FIGURE 1.
FIGURE 1.
Sequence properties and expression of SOUL. A, comparison of the BH3 domains among SOUL and Bcl-2 family members. Black-shaded amino acids are identical, dark gray-shaded amino acids are conserved substitutions, and light gray-shaded amino acids are semiconserved substitutions. Sequences of Bcl-xL, Bcl-2, Bcl-W, Bim, Bfk, Bik, Bid, Bax, Bad, and Bcl-2-KSHV proteins were accessed from the NCBI Protein data base. B, multiple-sequence alignment of SOUL and heme-binding protein 1 of representative vertebrates. HBP1, human heme-binding protein 1 (AAF89618); HBP1-Mouse, murine heme-binding protein 1 (NP_038574); SOUL-Mouse, murine SOUL protein (NP_062360); SOUL-Rat, rodent SOUL protein (XP_218664); SOUL-Chick, avian SOUL protein (NP_990120). Sequences were accessed from the NCBI Protein data base and were aligned using the ClustalW algorithm. Black-shaded amino acids are identical residues, dark gray-shaded amino acids are conserved substitutions, and light gray-shaded amino acids are semiconserved substitutions. C, expression of SOUL protein in cell lines and human tissues. Human tissue extracts were electrophoresed on 12% (w/v) SDS-PAGE. A single band was detected at 28 kDa by Western blot analysis using anti-SOUL antiserum developed in rabbits as primary antibody and horseradish peroxidase-labeled anti-rabbit IgG as secondary antibody. Protein bands were revealed by the ECL chemiluminescence system. A representative loading control developed for actin is shown below each blot. The positions of molecular mass markers are displayed on the left. Each lane contains 10 ng of total protein derived from the indicated tissues. The lanes of the left blot show the following (from left to right): SOUL antigen, melanoma, pancreas adenocarcinoma, neurogenic tumor, brain, Panc-1, HeLa, Jurkat, and NIH3T3 cell lines. The lanes of the right blot show the following (from left to right): SOUL antigen, placenta, muscle, liver, pancreas, lung, prostate, thyroid gland, and heart. Photomicrographs demonstrate representative blots of three independent experiments.
FIGURE 2.
FIGURE 2.
Intracellular localization of SOUL. A, immunofluorescent confocal microscopy analysis of GFP-SOUL in NIH3T3 cells. Cells were transfected with pEGFP-C1 plasmid containing the full-length SOUL open reading frame (2) or with pEGFP-C1 plasmid alone (1). Representative images of three independent experiments are presented. B, Western blot analysis of cytosolic (C), mitochondrial (M), and nuclear (N) fractions of HeLa cells treated (H2O2) or not (Control) with 100 μm H2O2 for 24 h. Western blotting was performed as described previously utilizing respective primary antibodies recognizing SOUL, the cytosolic marker glyceraldehyde-3-phosphate dehydrogenase (GA3PD), the mitochondrial marker pyruvate decarboxylase-1α (PDC-1α), and the nuclear marker histone H1 (Histon H1). Photomicrographs demonstrate representative blots of three independent experiments.
FIGURE 3.
FIGURE 3.
Mechanism of SOUL-facilitated cell death in vivo. A, translocations of AIF, Endo G, cyt-c, and Smac/DIABLO were detected by Western blotting after isolating cellular subfractions. Control SOUL- and ΔBH3-SOUL-overexpressing cells were treated or not with 100 μm H2O2 for 24 h. Glyceraldehyde-3-phosphate dehydrogenase (GAPDH) and histone H1 (Histon H1) were used as loading controls for the cytosolic and nuclear fraction, respectively. Photomicrographs demonstrate representative blots of three independent experiments. B, caspase-3 activation in SOUL-overexpressing cells. Cell death was induced by administering 500 μm H2O2 for 12 h in mock-transfected (dark gray bars; 1 and 2) and SOUL-overexpressing (light gray bars; 3 and 4) cells, and then the activity of caspase-3 was detected by using a fluorescent caspase-3 substrate, Ac-DEVD-7-amino-4-methylcoumarin. Values are means ± S.E. of three experiments. C, increase in H2O2-induced nuclear fragmentation. Mock-transfected (pcDNA) and NIH3T3 cells transfected with pcDNA3.1 vector subcloned with full-length SOUL cDNA (SOUL) were plated and treated or not with 1 mm H2O2 for 24 h and then were stained with Hoechst 33342 (blue) and propidium iodide (red) dyes. Representative images of three independent experiments are presented.
FIGURE 4.
FIGURE 4.
Effect of recombinant SOUL on permeability transition and mitochondrial membrane potential in isolated mitochondria. A, membrane potential was monitored by measuring the fluorescent intensities of the cationic fluorescent dye Rh-123. Isolated rat liver mitochondria added at the first arrow (*) took up the dye in a voltage-dependent manner and quenched its fluorescence. SOUL at the concentrations indicated together with 30 μm Ca2+ or 150 μm Ca2+ added at the second arrow (+) facilitated depolarization, resulting in release of the dye and an increase of fluorescence intensity. Line 1, no agent; line 2, 150 μm Ca2+; line 3, 30 μm Ca2+; line 4, 200 nm SOUL; line 5, 50 nm SOUL plus 30 μm Ca2+; line 6, 100 nm SOUL plus 30 μm Ca2+; line 7, 200 nm SOUL plus 30 μm Ca2+; line 8, 200 nm SOUL plus 2.5 μm CsA plus 30 μm Ca2+. Representative plots of three independent experiments are presented. B, permeability transition demonstrated by monitoring E540 in isolated rat liver mitochondria was induced by adding Ca2+ at the arrow. Line 1, no agent (base-line swelling); line 2, 150 μm Ca2+; line 3, 150 μm Ca2+ plus 2.5 μm CsA; line 4, 30 μm Ca2+; line 5, 50 nm SOUL plus 30 μm Ca2+; line 6, 100 nm SOUL plus 30 μm Ca2+; line 7, 200 nm SOUL plus 30 μm Ca2+; line 8, 200 nm SOUL plus 30 μm Ca2+ plus 2.5 μm CsA. Representative plots of three independent experiments are presented. C, effect of SOUL on the release of proapoptotic mitochondrial proteins from isolated rat liver mitochondria. Immunoblot analysis of AIF, Endo G, and cyt-c was performed from the supernatant after inducing mitochondrial permeability transition by 150 or 30 μm Ca2+ in the absence or presence of 2.5 μm CsA or different concentrations of SOUL. Lane 1, control (no agent added); lane 2, 150 μm Ca2+; lane 3, 150 μm Ca2+ plus 2.5 μm CsA; lane 4, 30 μm Ca2+; lane 5, 30 μm Ca2+ plus 100 nm SOUL; lane 6, 30 μm Ca2+ plus 200 nm SOUL; lane 7, 30 μm Ca2+ plus 200 nm SOUL plus 2.5 μm CsA. Photomicrographs demonstrate representative blots of three independent experiments.
FIGURE 5.
FIGURE 5.
Deletion of putative BH3 domain from SOUL and suppression of the wild-type protein abolished the effect of SOUL in H2O2-induced oxidative stress. Sham-transfected (pcDNA) ΔBH3-SOUL- and SOUL-expressing NIH3T3 cells (A and B) and SOUL-dsiRNA-transfected HeLa cells (C and D) were treated for 24 h with hydrogen peroxide at concentrations ranging from 0 to 500 μm (B) or from 0 to 600 μm (D). A, demonstration of expression of ΔBH3-SOUL and SOUL in the cells was performed by Western blotting utilizing anti-SOUL and anti-actin (loading control) primary antibodies. Photomicrographs demonstrate representative blots of three independent experiments. B, comparison of the effect of H2O2 on survival of NIH3T3 cells transfected with pcDNA3.1 (black bars), SOUL (white bars), or ΔBH3-SOUL (light gray bars). C, demonstration of SOUL expression in the HeLa cell homogenates prepared 1–4 days after transfection detected by Western blotting utilizing anti-SOUL polyclonal rabbit antiserum. D, comparison of the effect of H2O2 in HeLa cells (dark gray bars) and SOUL-dsiRNA-transfected HeLa cells (light gray bars) on the second day of transfection. Survival was measured by the MTT method and was expressed as percentage of the survival of untreated non-transfected cells. Values are means ± S.E. of three independent experiments. Significant differences are indicated above the bar. *, p < 0.01; **, p < 0.001.
FIGURE 6.
FIGURE 6.
Suppression of cyclophilin D abolished the effect of SOUL on H2O2-treated NIH3T3 cells. Suppression of CycD was achieved by co-transfecting or not (Control) sham-transfected (pcDNA) and SOUL-expressing (SOUL) NIH3T3 cells with 30 nm specific siRNA-expressing vector (CycD siRNA) according to the manufacturer's recommendation. The cells were treated for 24 h with hydrogen peroxide at concentrations ranging from 0 to 500 μm. A, demonstration of expression of SOUL and cyclophilin D in the cells was performed by Western blotting utilizing anti-SOUL and anti-cyclophilin D as well as anti-actin (loading control) primary antibodies. Photomicrographs demonstrate representative blots of three independent experiments. B, comparison of the effect of H2O2 on survival of NIH3T3 cells transfected with pcDNA3.1 (black bars), SOUL (light gray bars), pcDNA3.1 plus CycD siRNA (white bars), or SOUL plus CycD siRNA (dark gray bars). Survival was measured by the MTT method and was expressed as percentage of the survival of untreated double sham-transfected cells. Values are means ± S.E. of three independent experiments. Significant differences are indicated above the bar. *, p < 0.01; **, p < 0.001. C, detection of necrosis and apoptosis was by flow cytometry following fluorescein-conjugated annexin V and PI double staining performed at the end of a 24-h incubation in the presence or absence of 300 μm H2O2. D, pie charts demonstrate the distribution of living (white), necrotic (gray), and apoptotic (black) cells. Values are means of three independent experiments.
FIGURE 7.
FIGURE 7.
Antiapoptotic BH3 domain protein Bcl-2 abolished the effect of SOUL on H2O2-treated NIH3T3 cells. Bcl-2 was overexpressed by co-transfecting or not (Control) sham-transfected (pcDNA) and SOUL-expressing (SOUL) NIH3T3 cells with Bcl-2-expressing vector (Bcl-2). The cells were treated for 24 h with hydrogen peroxide at concentrations ranging from 0 to 500 μm. A, demonstration of expression of SOUL and Bcl-2 in the cells was performed by Western blotting utilizing anti-SOUL and anti-Bcl-2 as well as anti-actin (loading control) primary antibodies. Photomicrographs demonstrate representative blots of three independent experiments. B, comparison of the effect of H2O2 on survival of NIH3T3 cells transfected with pcDNA3.1 (black bars), SOUL (light gray bars), pcDNA3.1 plus Bcl-2 (white bars), or SOUL plus Bcl-2 (dark gray bars). Survival was measured by the MTT method and was expressed as a percentage of the survival of untreated double sham-transfected cells. Values are means ± S.E. of three independent experiments. Significant differences are indicated above the bar. *, p < 0.01; **, p < 0.001. C, detection of necrosis and apoptosis was by flow cytometry following fluorescein-conjugated annexin V and PI double staining performed at the end of a 24-h incubation in the presence or absence of 300 μm H2O2. Pie charts demonstrate the distribution of living (white), necrotic (gray), and apoptotic (black) cells. Values are means of three independent experiments.
FIGURE 8.
FIGURE 8.
Antiapoptotic BH3 domain protein Bcl-xL abolished the effect of SOUL on H2O2-treated NIH3T3 cells. Bcl-xL was overexpressed by co-transfecting or not (Control) sham-transfected (pcDNA) and SOUL-expressing (SOUL) NIH3T3 cells with Bcl-xL-expressing vector (Bcl-xL). The cells were treated for 24 h with hydrogen peroxide at concentrations ranging from 0 to 500 μm. A, demonstration of expression of SOUL and Bcl-xL in the cells was performed by Western blotting utilizing anti-SOUL and anti-Bcl-xL as well as anti-actin (loading control) primary antibodies. Photomicrographs demonstrate representative blots of three independent experiments. B, comparison of the effect of H2O2 on survival of NIH3T3 cells transfected with pcDNA3.1 (black bars), SOUL (light gray bars), pcDNA3.1 plus Bcl-xL (white bars), or SOUL plus Bcl-xL (dark gray bars). Survival was measured by the MTT method and was expressed as a percentage of the survival of untreated double sham-transfected cells. Values are means ± S.E. of three independent experiments. Significant differences are indicated above the bar. *, p < 0.01; **, p < 0.001. C, detection of necrosis and apoptosis was by flow cytometry following fluorescein-conjugated annexin V and PI double staining performed at the end of a 24-h incubation in the presence or absence of 300 μm H2O2. Pie charts demonstrate the distribution of living (white), necrotic (gray), and apoptotic (black) cells. Values are means of three independent experiments.
FIGURE 9.
FIGURE 9.
SOUL depolarizes mitochondrial membrane in vivo in H2O2-treated NIH3T3 cells. Mock-transfected (pcDNA) and SOUL- and ΔBH3-SOUL-overexpressing cells were co-transfected or not with vectors expressing cyclophilin D siRNA (A) or Bcl-2 protein (B). All cells were exposed or not to 100 μm hydrogen peroxide for 3 h, and then the medium was replaced with a fresh one without any agents and containing 1 μm JC-1 membrane potential-sensitive fluorescent dye. After 10 min of loading, green and red fluorescence images of the same field were acquired using a fluorescent microscope equipped with a digital camera. The images were merged to demonstrate depolarization of mitochondrial membrane potential in vivo indicated by loss of the red component of the merged image. Representative merged images of three independent experiments are presented.
FIGURE 10.
FIGURE 10.
Schematic diagram of the proposed molecular mechanism of SOUL. Subeffective concentration of Ca2+ or free radicals together with SOUL induces permeability transition accompanied by the loss of mitochondrial membrane potential and the release of intermembrane proteins, eventually leading to cell death. CsA, suppression of cyclophilin D, Bcl-2, or Bcl-xL prevents this process, indicating the direct effect of SOUL on the mitochondrial permeability transition pore (mPTP). Established components of the mitochondrial permeability transition pore are indicated schematically. ANT, adenine nucleotide translocator; Cyp-D, cyclophilin D; CL, adenine nucleotide translocator-associated cardiolipin; HK, hexokinase; Bcl-2, B-cell-associated leukemia protein 2; Bcl-xL, B-cell-associated leukemia protein xL. Note that the exact stochiometry and composition of the mitochondrial permeability transition pore are elusive. Moreover, the mitochondrial permeability transition pore composition is not fully illustrated and may be cell type-dependent.

Similar articles

Cited by

References

    1. Szigeti A., Bellyei S., Gasz B., Boronkai A., Hocsak E., Minik O., Bognar Z., Varbiro G., Sumegi B., Gallyas F., Jr. (2006) FEBS Lett. 580, 6447–6454 - PubMed
    1. Shimizu S., Tsujimoto Y. (2000) Proc. Natl. Acad. Sci. U.S.A. 97, 577–582 - PMC - PubMed
    1. Bouillet P., Strasser A. (2002) J. Cell Sci. 115, 1567–1574 - PubMed
    1. Hsu S. Y., Hsueh A. J. (2000) Physiol. Rev. 80, 593–614 - PubMed
    1. Martinou J. C., Green D. R. (2001) Nat. Rev. Mol. Cell Biol. 2, 63–67 - PubMed

Publication types

MeSH terms