Multicenter Study
. 2009 Nov 23;206(12):2583-91.
doi: 10.1084/jem.20090892. Epub 2009 Nov 9.

Two loci control tuberculin skin test reactivity in an area hyperendemic for tuberculosis

Affiliations
Multicenter Study

Two loci control tuberculin skin test reactivity in an area hyperendemic for tuberculosis

Aurelie Cobat et al. J Exp Med. .

Abstract

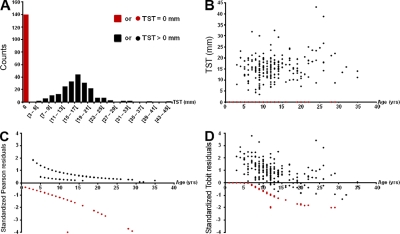
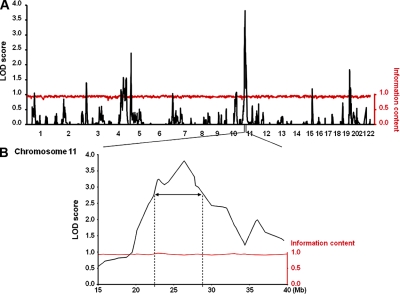
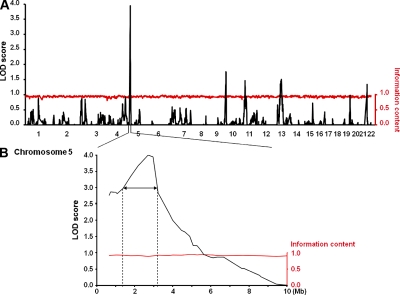
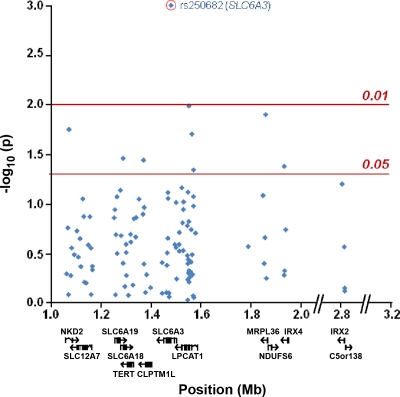
Approximately 20% of persons living in areas hyperendemic for tuberculosis (TB) display persistent lack of tuberculin skin test (TST) reactivity and appear to be naturally resistant to infection by Mycobacterium tuberculosis. Among those with a positive response, the intensity of TST reactivity varies greatly. The genetic basis of TST reactivity is not known. We report on a genome-wide linkage search for loci that have an impact on TST reactivity, which is defined either as zero versus nonzero (TST-BINa) or as extent of TST in millimeters (TST-quantitative trait locus [QTL]) in a panel of 128 families, including 350 siblings, from an area of South Africa hyperendemic for TB. We detected a major locus (TST1) on chromosomal region 11p14 (P = 1.4 x 10(-5)), which controls TST-BINa, with a lack of responsiveness indicating T cell-independent resistance to M. tuberculosis. We also detected a second major locus (TST2) on chromosomal region 5p15 (P < 10(-5)), which controls TST-QTL or the intensity of T cell-mediated delayed type hypersensitivity (DTH) to tuberculin. Fine mapping of this region identified SLC6A3, encoding the dopamine transporter DAT1, as a promising gene for further studies. Our results pave the way for the understanding of the molecular mechanisms involved in resistance to M. tuberculosis infection in endemic areas (TST1) and for the identification of critical regulators of T cell-dependent DTH to tuberculin (TST2).


Figures

Figure 1.
Figure 1.
Distribution of TST according to age among the 350 children used for the linkage analysis before and after adjustment on relevant covariates. (A) Distribution of TST values among the 350 children used for the linkage analysis. A total of 140 subjects had no measurable reaction (red bar) and 210 subjects had TST induration > 0 mm (black bars). (B) Distribution of TST values among the 350 children according to age in years (same color coding as in A). Note that the red dots reflect variable numbers of subjects with TST = 0. Overall, 3, 2, 6, 2, 5, 22, 10, 20, 17, 11, 11, 13, 6, 2, 2, and 3 subjects had a TST = 0 at the ages of 1, 2, 3, 4, 5, 6, 7, 8, 9, 10, 11, 12, 13, 16, 19, and 20 yr, respectively. (C) Distribution of the Pearson residuals obtained by logistic regression of TST-BINa on age, sex, and previous TB according to age in years. Color coding indicates those subjects with TST = 0 (red) or TST > 0 (black). As detailed in B, red dots, i.e., subjects with TST = 0, usually represent multiple persons. The two red dot outliers correspond to two subjects with previous TB and TST = 0. (D) Distribution of the residuals obtained by Tobit regression of TST-QTL on age, sex, and previous TB according to age in years. Color coding indicates those subjects with TST = 0 (red) or TST > 0 (black). As detailed in B, red dots, i.e., subjects with TST = 0, usually represent multiple persons. The two red dot outliers correspond to two subjects with previous TB and TST = 0.
Figure 2.
Figure 2.
Genome-wide model-free linkage analysis of TST-BINa in a panel of 128 families including 350 siblings. (A) Multipoint LOD score (black line; left y-axis) and IC (red line; right y-axis) are plotted along the 22 autosomes. (B) Expanded view of the region with the highest LOD score on chromosome 11. The multipoint LOD score (black line), IC at marker positions (red line), and 90% confidence intervals for the location of the QTL (arrow and dashed lines) are given. Left and right y-axes indicate LOD score and IC, respectively. Chromosomal positions are given in megabases (Mb).
Figure 3.
Figure 3.
Genome-wide model-free linkage analysis of TST-QTL in a panel of 128 families including 350 siblings. (A) Multipoint LOD score (black line; left y-axis) and IC (red line; right y-axis) are plotted along the 22 autosomes. (B) Expanded view of the region with the highest LOD score on chromosome 5. The multipoint LOD score (black line), IC at marker positions (red line), and 90% confidence intervals for the location of the QTL (arrow and dashed lines) are given. Left and right y-axes indicate LOD score and IC, respectively. Chromosomal positions are given in megabases (Mb).
Figure 4.
Figure 4.
Fine mapping of the 90% confidence interval for the location of TST2 locus in a panel of 128 families including 350 siblings. Evidence for association with TST-QTL of 113 SNPs located in the 90% confidence linkage interval is given as −log10P and plotted against SNP position (blue diamonds). The locations of the 13 genes of this region are provided. Two intervals with no annotated genes (2–2.7 Mb and 2.9–3.2 Mb) are not shown (//). The red lines indicate the P = 0.05 and P = 0.01 significance thresholds.

References

    1. Alcaïs A., Abel L. 1999. Maximum-Likelihood-Binomial method for genetic model-free linkage analysis of quantitative traits in sibships. Genet. Epidemiol. 17:102–117 10.1002/(SICI)1098-2272(1999)17:2<102::AID-GEPI2>3.0.CO;2-6 - DOI - PubMed
    1. Alcaïs A., Sanchez F.O., Thuc N.V., Lap V.D., Oberti J., Lagrange P.H., Schurr E., Abel L. 2000. Granulomatous reaction to intradermal injection of lepromin (Mitsuda reaction) is linked to the human NRAMP1 gene in Vietnamese leprosy sibships. J. Infect. Dis. 181:302–308 10.1086/315174 - DOI - PubMed
    1. Alcaïs A., Fieschi C., Abel L., Casanova J.L. 2005. Tuberculosis in children and adults: two distinct genetic diseases. J. Exp. Med. 202:1617–1621 10.1084/jem.20052302 - DOI - PMC - PubMed
    1. Alcaïs A., Alter A., Antoni G., Orlova M., Nguyen V.T., Singh M., Vanderborght P.R., Katoch K., Mira M.T., Vu H.T., et al. 2007. Stepwise replication identifies a low-producing lymphotoxin-alpha allele as a major risk factor for early-onset leprosy. Nat. Genet. 39:517–522 10.1038/ng2000 - DOI - PubMed
    1. ATS-CTC-IDSA 2000. Diagnostic standards and classification of tuberculosis in adults and children. This official statement of the American Thoracic Society and the Centers for Disease Control and Prevention was adopted by the ATS Board of Directors, July 1999. This statement was endorsed by the Council of the Infectious Disease Society of America, September 1999. Am. J. Respir. Crit. Care Med. 161:1376–1395 - PubMed

Publication types

MeSH terms

Substances