. 2010 Jan;54(1):491-501.
doi: 10.1128/AAC.01075-09. Epub 2009 Nov 9.

Impact of Y143 HIV-1 integrase mutations on resistance to raltegravir in vitro and in vivo

Affiliations

Impact of Y143 HIV-1 integrase mutations on resistance to raltegravir in vitro and in vivo

Olivier Delelis et al. Antimicrob Agents Chemother. 2010 Jan.

Abstract

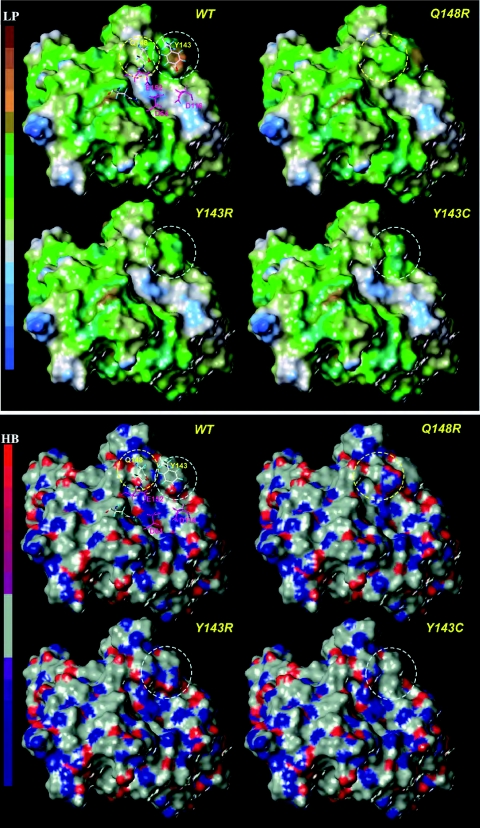
Integrase (IN), the HIV-1 enzyme responsible for the integration of the viral genome into the chromosomes of infected cells, is the target of the recently approved antiviral raltegravir (RAL). Despite this drug's activity against viruses resistant to other antiretrovirals, failures of raltegravir therapy were observed, in association with the emergence of resistance due to mutations in the integrase coding region. Two pathways involving primary mutations on residues N155 and Q148 have been characterized. It was suggested that mutations at residue Y143 might constitute a third primary pathway for resistance. The aims of this study were to investigate the susceptibility of HIV-1 Y143R/C mutants to raltegravir and to determine the effects of these mutations on the IN-mediated reactions. Our observations demonstrate that Y143R/C mutants are strongly impaired for both of these activities in vitro. However, Y143R/C activity can be kinetically restored, thereby reproducing the effect of the secondary G140S mutation that rescues the defect associated with the Q148R/H mutants. A molecular modeling study confirmed that Y143R/C mutations play a role similar to that determined for Q148R/H mutations. In the viral replicative context, this defect leads to a partial block of integration responsible for a weak replicative capacity. Nevertheless, the Y143 mutant presented a high level of resistance to raltegravir. Furthermore, the 50% effective concentration (EC(50)) determined for Y143R/C mutants was significantly higher than that obtained with G140S/Q148R mutants. Altogether our results not only show that the mutation at position Y143 is one of the mechanisms conferring resistance to RAL but also explain the delayed emergence of this mutation.


Figures

FIG. 1.
FIG. 1.
Infectivity and resistance of the mutants. (A) Quantification of p24 protein 48 h after transfection of 5 μg of the DNA corresponding to each virus. (B) Viral infectivity of each mutant was determined using the CPRG assay. HeLa-P4 indicator cells (105) were infected with 3 ng/10,000 cells of p24 antigen for 48 h, corresponding to about 40% of the cells being infected for the wild-type virus. The early stages of infection were assessed by measuring the β-galactosidase activity in cell extracts by the CPRG method compared to the signal obtained for uninfected cells (n.i., no infection). The background, corresponding to the CPRG signal obtained for an abortive viral infection, was determined in the presence of 50 μM AZT. (C) HeLa-P4 cells were infected in triplicate, using amounts of p24 antigen that give the same infectivity without RAL. Data from a representative experiment are shown. The EC50 was determined as the concentration of RAL inhibiting β-galactosidase production by 50% in comparison with results for untreated infected cells. For all panels, confidence interval analysis was used with n = 3 and with a p value < 0.05 considered statistically significant.
FIG. 2.
FIG. 2.
Impairment of viral integration for Y143R and Y143C mutants. MT4 cells (106) were infected with 50 ng of p24 antigen, and intracellular HIV-1 DNA species levels were quantified by real-time PCR. (A) Percentage of integrated viral DNA 24 h postinfection for each mutant in the presence (dark-gray bars) or absence (light-gray bars) of RAL. The percentage of integrated viral DNA was determined by dividing the integrated viral DNA copy number by total viral DNA 24 h postinfection. (B) Percentage of 2-LTR circles for each mutant in the presence (black bar) or absence (white bar) of RAL. “#” indicates a significant difference with the wild-type virus in a t test with a P value < 0.05.
FIG. 3.
FIG. 3.
Comparison of resistance levels of Y143R/C and G140S/Q148H mutants. HeLa-P4 cells were infected in triplicate with an amount of p24 antigen (30 ng) yielding the same infectivity for mutated viruses as that obtained with 3 ng of wild-type virus in the absence of RAL (i.e., multiplicity of infection = 0.4). The EC50 was determined as the concentration of RAL inhibiting β-galactosidase production by 50% in comparison to results for the untreated infected cells. Confidence interval analysis was used with n = 3 and with a P value < 0.05 considered statistically significant.
FIG. 4.
FIG. 4.
Comparative study of the DNA-binding and 3′-processing activity of wild-type and Y143R/C INs. (A) DNA binding of wild-type and Y143R/C mutants. The DNA binding step was assessed as described in Materials and Methods (see equation 1). Increasing concentrations of IN and DNA (4 nM) were incubated together for 15 min before steady-state anisotropy as recorded. (B) 3′-Processing activity after 3 h of incubation at 37°C as a function of the IN concentration monitored by steady-state fluorescence anisotropy using a 21-mer DNA substrate (4 nM) with MgCl2 (10 mM) as a metallic cofactor in 20 mM HEPES (pH 7.2), 1 mM DTT, and 30 mM NaCl. IN and DNA were incubated together for 15 min before steady-state anisotropy as recorded. 3′-P activities were quantified as described in Materials and Methods (see equation 2). The same symbols were used in panels A and B: black triangle, WT IN; white square, Y143R IN; and black circle, Y143C IN. (C) 3′-Processing kinetics for the WT and Y143R/C mutants. 3′-P activity for the Y143R/mutants was normalized against WT activity during the course of the experiment. Time is indicated in hours. Symbols used are as follows: white bar, Y143R IN; black bar, Y143C IN.
FIG. 5.
FIG. 5.
In vitro RAL resistance of the wild-type and Y143R/C mutants. (A) 3′-P activity (after 3 h of incubation at 37°C) at a concentration of 200 nM IN. A representative gel showing RAL resistance with respect to the IN mutation. Drug concentrations are indicated above each lane. The 32P-labeled oligonucleotide, the substrate used in this reaction, is indicated by an arrow (21-mer). The product of the 3′-P reaction is indicated by an arrow (19-mer). Products of the ST reaction are indicated (ST products). Activity of each protein at 200 nM is indicated on the right of the gel, normalized against WT activity. (B) Strand transfer reaction of the Y143R/C mutants. The ST reaction was performed using a 32P-labeled oligonucleotide mimicking the preprocessed substrate. Drug concentrations are indicated above each lane. Percentage of the ST activity of each mutant was normalized against WT activity. 3′-P and ST activities were quantified as described in Materials and Methods. Experiments were performed three times. An unpaired t test was used to derive P values.
FIG. 6.
FIG. 6.
Effect of the mutations on RAL resistance in strand transfer assay. Strand-transfer reactions were carried out for 3 h in the presence of increasing RAL concentrations.
FIG. 7.
FIG. 7.
Lipophilic potential (LP) (top) and hydrogen bonding site (HB) (bottom) surfaces of wild-type and raltegravir-resistant mutants. LP and HB calculations performed on the Connolly solvent-accessible surface of the INs were determined using the MOLCADE subroutine from SYBYL 8.0 (Tripos Inc., St Louis, MO). The color ramp for LP ranges from brown spots (highest lipophilic potential area of the molecule) to blue spots (highest hydrophilic area). The color ramp for HB ranges from red (hydrogen donors; low electronegativity) to blue (hydrogen acceptors; high electronegativity). The RAL-resistant and catalytic residues are shown as sticks and in magenta, respectively. The areas corresponding to the RAL resistance mutations on the IN surface are delimited by dashed circles, yellow for Q148R and Y143R/C and blue for N155H.
FIG. 8.
FIG. 8.
HIV-1 IN interactions with viral DNA based on theoretical models. (A) Donor (red) and acceptor (blue) surfaces of the WT (left) and mutated residues (right) Q148R and Y143R. Arginine is presented as two tautomeric forms. (B) HIV-1 IN interactions with viral DNA according to theoretical models by Chen et al. (6) (left) and by Wielens et al. (38) (right).

Similar articles

Cited by

References

    1. Agapkina, J., M. Smolov, S. Barbe, E. Zubin, T. Zatsepin, E. Deprez, B. M. Le, J. F. Mouscadet, and M. Gottikh. 2006. Probing of HIV-1 integrase-DNA interactions using novel analogs of viral DNA. J. Biol. Chem. 281:11530-11540. - PubMed
    1. Brown, P. O. 1990. Integration of retroviral DNA. Curr. Top. Microbiol. Immunol. 157:19-48. - PubMed
    1. Brussel, A., O. Delelis, and P. Sonigo. 2005. Alu-LTR real-time nested PCR assay for quantifying integrated HIV-1 DNA. Methods Mol. Biol. 304:139-154. - PubMed
    1. Bushman, F. D., and R. Craigie. 1991. Activities of human immunodeficiency virus (HIV) integration protein in vitro: specific cleavage and integration of HIV DNA. Proc. Natl. Acad. Sci. U. S. A. 88:1339-1343. - PMC - PubMed
    1. Ceccherini-Silberstein, F., I. Malet, R. D'Arrigo, A. Antinori, A. G. Marcelin, and C. F. Perno. 2009. Characterization and structural analysis of HIV-1 integrase conservation. AIDS Rev. 11:17-29. - PubMed

Publication types

MeSH terms