. 2010 Jan 14;115(2):418-29.
doi: 10.1182/blood-2008-12-196840. Epub 2009 Nov 9.

Inflammation induces lymphangiogenesis through up-regulation of VEGFR-3 mediated by NF-kappaB and Prox1

Affiliations

Inflammation induces lymphangiogenesis through up-regulation of VEGFR-3 mediated by NF-kappaB and Prox1

Michael J Flister et al. Blood. .

Abstract

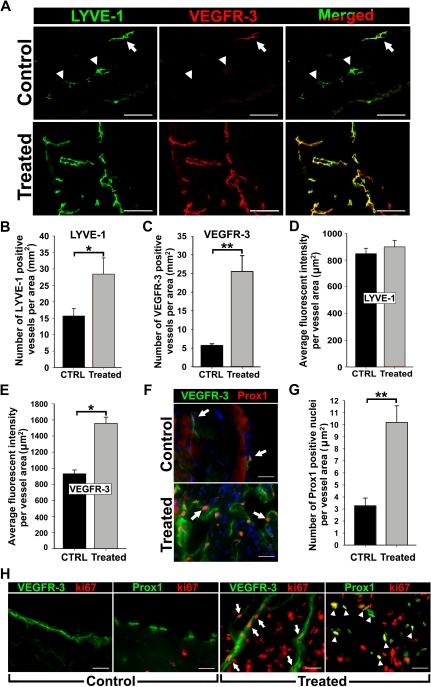
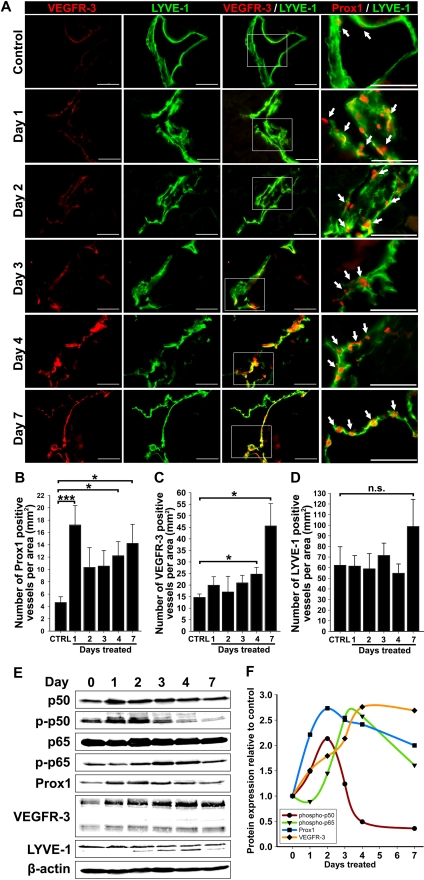
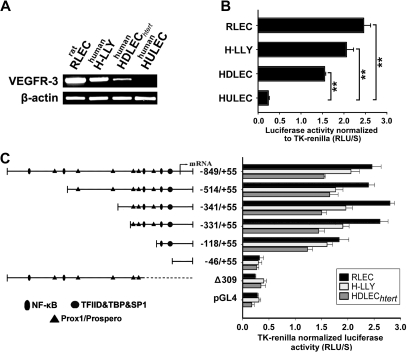
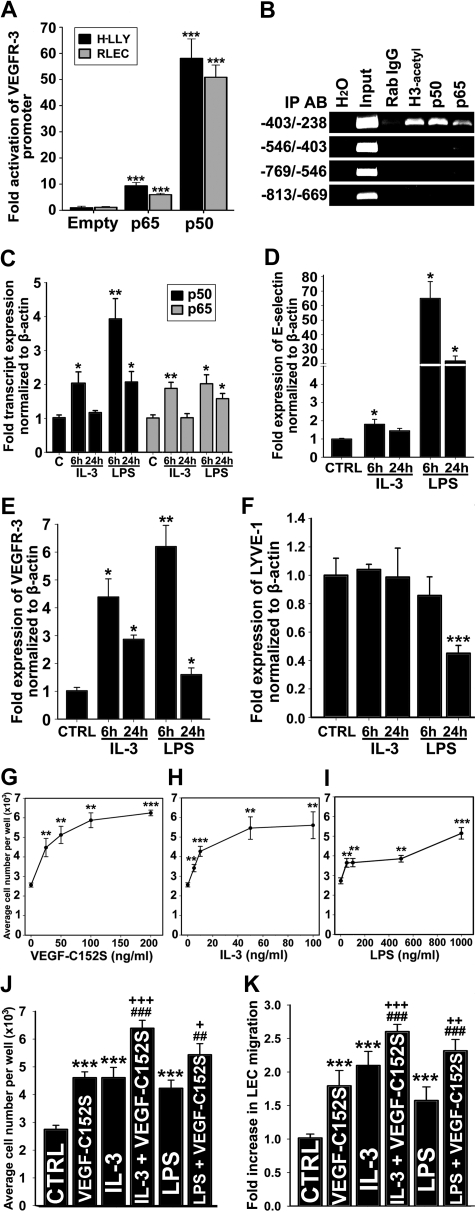
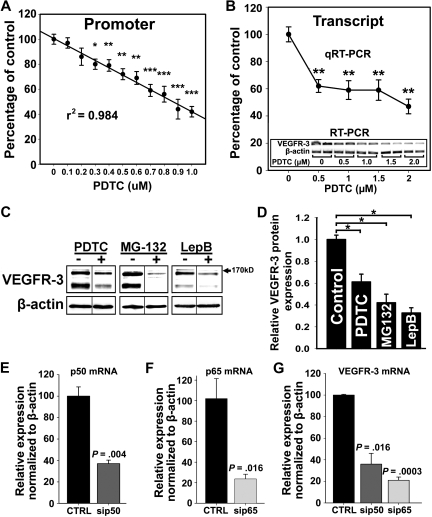
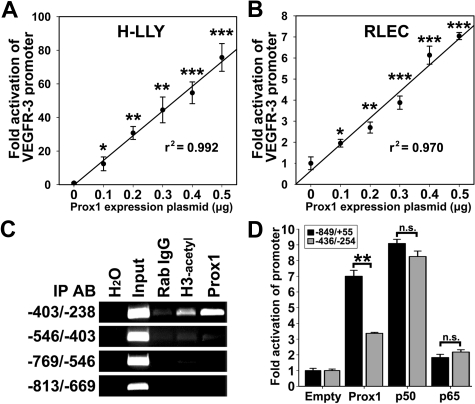
The concept of inflammation-induced lymphangiogenesis (ie, formation of new lymphatic vessels) has long been recognized, but the molecular mechanisms remained largely unknown. The 2 primary mediators of lymphangiogenesis are vascular endothelial growth factor receptor-3 (VEGFR-3) and Prox1. The key factors that regulate inflammation-induced transcription are members of the nuclear factor-kappaB (NF-kappaB) family; however, the role of NF-kappaB in regulation of lymphatic-specific genes has not been defined. Here, we identified VEGFR-3 and Prox1 as downstream targets of the NF-kappaB pathway. In vivo time-course analysis of inflammation-induced lymphangiogenesis showed activation of NF-kappaB followed by sequential up-regulation of Prox1 and VEGFR-3 that preceded lymphangiogenesis by 4 and 2 days, respectively. Activation of NF-kappaB by inflammatory stimuli also elevated Prox1 and VEGFR-3 expression in cultured lymphatic endothelial cells, resulting in increased proliferation and migration. We also show that Prox1 synergizes with the p50 of NF-kappaB to control VEGFR-3 expression. Collectively, our findings suggest that induction of the NF-kappaB pathway by inflammatory stimuli activates Prox1, and both NF-kappaB and Prox1 activate the VEGFR-3 promoter leading to increased receptor expression in lymphatic endothelial cells. This, in turn, enhances the responsiveness of preexisting lymphatic endothelium to VEGFR-3 binding factors, VEGF-C and VEGF-D, ultimately resulting in robust lymphangiogenesis.


Figures

Figure 1
Figure 1
Inflammation induces VEGFR-3 and Prox1 expression in activated lymphatic vessels. Peritonitis was induced by repetitive intraperitoneal injections of thioglycollate (TG) every 48 hours for 2 weeks. (A) Diaphragms from mice treated for 2 weeks with TG to induce peritonitis or saline as a control (n = 3 mice per group) were double-stained with anti–LYVE-1 and anti–VEGFR-3 antibodies. Note strong expression and complete overlap of VEGFR-3 with LYVE-1 in inflamed tissues compared with quiescent lymphatic vessels in control sections with weakly detected (arrow) or absent (arrowheads) VEGFR-3. LYVE-1+ (B) and VEGFR-3+ (C) lymphatic vessels were counted on the entire diaphragm sections and the numbers were normalized per total section area expressed in square millimeters. The results are presented as the mean vessel density per group ± SEM. (B) *P < .05 versus control as determined by Wilcoxon rank sum test. (C) **P < .01 versus control as determined by Student unpaired t test. The mean fluorescent intensity (MFI) per vessel was analyzed on LYVE-1+ (D) and VEGFR-3+ (E) lymphatic vessels (5-10 vessels per diaphragm). MFI is expressed as relative units normalized per vascular area expressed in square micrometers. The mean MFI values ± SEM derived from 3 mice per group are shown. (E) *P < .05 versus control, as determined by nested analysis of variance described in “Statistical analysis.” (F) Diaphragms from TG-treated and control mice were double-stained with anti-Prox1 and anti–VEGFR-3 antibodies. Arrows point to Prox1+ nuclei. (G) Prox1+ nuclei were enumerated and normalized per LYVE-1+ lymphatic area (μm2) in diaphragms of TG- and saline-treated control mice. **P < .01 versus control as determined by Student unpaired t test. (H) Diaphragm sections were costained with antibodies against VEGFR-3 or Prox1 and a proliferative marker, Ki-67, to assess proliferative status of lymphatic vessels in the diaphragms of TG-treated or control mice. Note overlapping expression of Ki-67/VEGFR-3 (arrow) and Ki-67/Prox1 (arrowhead) detected in inflamed lymphatic vessels but absent from quiescent lymphatic vessels in control tissues. Scale bars represent 100 μm (A) and 20 μm (F,H).
Figure 2
Figure 2
Up-regulation of VEGFR-3 and Prox1 precedes new lymphatic vessel formation during inflammation. (A) Double immunostaining of VEGFR-3/LYVE-1 and Prox1/LYVE-1 in serial diaphragm sections derived from mice treated with saline or TG (n = 3-4 mice per group) and harvested 1, 2, 3, 4, and 7 days after onset of treatment. Scale bars represent 50 μm. Lymphatic vessels shown are representative of whole diaphragm sections from 3 to 4 mice per group. (B-D) Quantification of Prox1-positive (B), VEGFR-3—positive (C), and LYVE-1—positive (D) vessels normalized per area of the entire diaphragm section measured in square millimeters. Quantitative analysis was performed on diaphragms harvested from 3 to 4 mice per group at indicated days after the first TG or saline injection. Data are presented as the mean number of vessels per diaphragm section ± SEM; ns denotes nonsignificant changes; *P < .05 and ***P < .01 versus control, as determined by Student unpaired t test. (E) Protein expression of Prox1, VEGFR-3, LYVE-1, NF-κB p50 phosphorylated on Ser337, nonphosphorylated NF-κB p50, NF-κB p65 phosphorylated on Ser276, nonphosphorylated NF-κB p65, and β-actin was determined by Western blot of combined lysates (100 μg of total protein per lane) derived from 3 to 4 mice per group. (F) Protein expression in Western blots was determined by band densitometry. Values were normalized to β-actin and are shown as fold increase relative to expression of corresponding proteins in untreated control mice at day 0.
Figure 3
Figure 3
VEGFR-3 promoter characterization and gene expression in lymphatic endothelial cells. (A) VEGFR-3 mRNA expression and (B) full-length VEGFR-3−849/+55 promoter activity were measured in the lymphatic endothelial cell lines RLECs, H-LLY, and HDLECshtert. Human lung blood microvascular endothelial cell line, HULEC, was used as a VEGFR-3–negative cell line. Data shown are a representative image of VEGFR-3 transcript expression of 3 independent experiments (A) and the mean promoter activity of 3 independent experiments ± SEM (B). **P < .01 versus VEGFR-3 promoter activity in the negative control cell line HULEC as determined by Student unpaired t test. (C) Activities of VEGFR-3 promoter deletion constructs were tested in RLECs, H-LLY, and HDLECshtert. The left panel shows schematic illustration of deletion constructs with relative locations of predicted transcription factor binding sites. The right panel shows VEGFR-3 promoter activity of deletion constructs presented as relative light units per second (RLU/S) normalized per renilla luciferase activity of cotransfected thymidine kinase (TK)–renilla plasmid. Experiments were performed in duplicate and reproduced at least 3 times. Data are presented as the mean promoter activity of 3 independent experiments ± SEM.
Figure 4
Figure 4
NF-κB pathway up-regulates VEGFR-3 expression and activates lymphatic endothelial cells. (A) VEGFR-3 promoter activity in RLECs and H-LLY cells cotransfected with VEGFR-3−849/+55 and pCMV-Flag-p50, pCMV-Flag-p65, or empty control plasmids. Promoter activity is normalized per milligram of protein. Data presented for each cell line as the mean promoter activity ± SEM of 3 independent experiments performed in duplicate ± SEM (total n = 6 per experimental condition). ***P < .001 versus control as determined by Student unpaired t test. (B) ChIP was performed using RLECs and anti-p65, -p50, and -acetylated histone H3 antibodies (positive control), or nonspecific rabbit IgG (negative control). Immunoprecipitated chromatin was visualized by PCR using primers either flanking (−403/−238 bp) or upstream of putative NF-κB binding sites (−813/−403 bp). Data are representative of 4 independent ChIP experiments with similar results. (C-F) qRT-PCR analysis of NF-κB p50 and p65 (C), E-selectin (D), VEGFR-3 (E), and LYVE-1 (F) mRNA expression in HDLECshtert treated with IL-3 (10 ng/mL) or LPS (100 ng/mL) for 6 or 24 hours. The relative expression of each target was normalized to β-actin. Data are presented as the mean values of 3 independent experiments ± SEM. *P < .05, **P < .01, and ***P < .001 versus control as determined by Student unpaired t test. (G-I) RLEC proliferation induced by 72-hour exposure to VEGF-C152S (25-200 ng/mL; G), IL-3 (5-100 ng/mL; H), and LPS (50-1000 ng/mL; I). (J) Additive proliferative effects of RLECs treated with VEGF-C152S (100 ng/mL), IL-3 (10 ng/mL), or LPS (500 ng/mL) alone compared with pretreatment with IL-3 (10 ng/mL) or LPS (500 ng/mL) followed by stimulation with VEGF-C152S (100 ng/mL). (G-J) Data are presented as the average cell number of 3 independent experiments ± SEM (total n = 6 per condition). (K) Migration of RLECs induced by treatment with VEGF-C152S (200 ng/mL), IL-3 (10 ng/mL), or LPS (500 ng/mL) and combined treatment with IL-3 (10 ng/mL) and VEGF-C152S (200 ng/mL) or LPS (500 ng/mL) and VEGF-C152S (200 ng/mL). RLEC migration toward 0.25% FBS was used as a negative control. Data presented as average fold increase in RLEC migration ± SEM of 3 independent experiments. (J-K) *P < .05, **P < .01, and ***P < .001 versus control. ##P < .01 and ###P < .001 versus cytokine treatment alone. +P < .05, ++P < .01, and +++P < .001 versus VEGF-C152S treatment alone. All statistical tests were done by Student unpaired t test.
Figure 5
Figure 5
NF-κB signaling is required for VEGFR-3 expression in lymphatic endothelial cells. (A) RLECs were transfected with the full-length VEGFR-3−849/+55 promoter and treated with PDTC (0-1μM) or vehicle for 18 hours. Promoter activity was measured by luciferase assay and normalized to total protein per well. Note linear inhibition of VEGFR-3 promoter activity by PDTC determined by linear regression (r2 shown on graph) of the mean promoter activity ± SEM of 3 independent experiments performed in duplicate (total n = 6 per condition). (B) VEGFR-3 transcript expression assayed by qRT-PCR in RLECs treated with PDTC (0-2μM) or vehicle. Data are presented as mean transcript expression normalized to β-actin of 3 independent experiments ± SEM (total n = 3 per condition). Inset shows a dose-dependent decrease of VEGFR-3 transcript detected by RT-PCR. (B-C) *P < .05 versus control, **P < .01 versus control, ***P < .001 versus control, by Student unpaired t test. (C) Western blot analysis of RLECs treated with PDTC (7.5μM), MG-132 (0.25μM), leptomycin B (10nM), or vehicle for 24 hours. β-Actin was used as a loading control. Vertical lines have been inserted to indicate repositioned gel lanes from blots presented in supplemental Figure 6, which show dose-dependent responses to NF-κB inhibitors. (D) Densitometric values demonstrate a statistically significant decrease in VEGFR-3 protein normalized to β-actin from RLECs treated with NF-κB inhibitors or vehicle for 24 hours. Experiments were performed in duplicate and data are presented as mean normalized per β-actin VEGFR-3 expression ± SEM; *P < .05 versus control, by Student unpaired t test. (E-G) H-LLY cells were transfected with p50- or p65-specific siRNA or scramble control siRNA for 48 hours and transcript expression for p50 (E), p65 (F), and VEGFR-3 (G) was determined by qRT-PCR. Data are presented as the mean transcript expression normalized to β-actin of 3 independent samples ± SEM (n = 3 per condition). Statistically significant differences were determined versus control, by Student unpaired t test. P values are displayed on the graphs.
Figure 6
Figure 6
Prox1 directly activates the VEGFR-3 promoter. VEGFR-3−849/+55 promoter plasmid was cotransfected with pCMV-Prox1 plasmid (0-0.5 μg) in H-LLY cells (A) and RLECs (B). Promoter activity was measured by luciferase assay and normalized per milligram of protein. Note linear response to Prox1 transactivation in both cell lines as determined by linear regression (r2 shown on graph) of the mean promoter activity ± SEM of 3 independent experiments performed in duplicate (n = 6 per condition; A-B). (A-B) *P < .05 versus control, **P < .01 versus control, ***P < .001 versus control, by Student unpaired t test. (C) ChIP analysis of the VEGFR-3 promoter was performed on RLECs as described in the legend for Figure 4. Immunoprecipitated chromatin was visualized by PCR with primers flanking transcription factor binding sites (−403/−238 bp) or upstream of binding sites (−813/−403 bp). Data are representative of 3 independent ChIP experiments with similar results. (D) Fold activation of a truncated VEGFR-3 promoter (−436/−254) was compared with the full-length VEGFR-3−849/+55. RLECs were cotransfected with 0.5 μg of VEGFR-3−849/+55 or VEGFR-3−436/−254 promoter plasmids and 0.5 μg of pCMV-Prox1, pCMV-Flag-p50, pCMV-Flag-p65, or empty control plasmid. Promoter activity is normalized per milligram of protein. Data are presented as the mean promoter activity of 3 independent experiments performed in duplicate ± SEM (total n = 6 per experimental condition). ns denotes nonsignificant changes. **P < .01 versus control as determined by Student unpaired t test.
Figure 7
Figure 7
The p50 subunit of NF-κB up-regulates Prox1, and both p50 and Prox1 synergistically regulate VEGFR-3 expression. (A) qRT-PCR analysis of Prox1 transcripts in HDLECshtert treated with IL-3 (10 ng/mL) for 6 hours. (B) qRT-PCR analysis of Prox1 transcripts in RLECs treated with PDTC (2.5μM) for 24 hours. (A-B) Data are presented as β-actin normalized mean transcript expression of 3 independent experiments performed in duplicate ± SEM (total: n = 6 per condition). (C) Prox1 detected by Western blot of nuclear extracts from RLECs treated with PDTC (5μM), MG-132 (250nM), leptomycin B (10nM), or vehicle alone. β-Actin was used as a loading control. Representative data are shown from 1 of 3 experiments. (D) qRT-PCR analysis of Prox1 transcript in H-LLY transfected with p50 and p65 siRNA. Data are presented as the mean transcript expression normalized to β-actin ± SEM derived from 3 independent samples. (E) Prox1-negative nonendothelial line HEK293 was transfected with VEGFR-3−849/+55 promoter plasmid and pCMV-Flag-p50 or pCMV-Flag-p65 plasmids and cotransfected with pCMV-Prox1 or empty vector (0.25 μg of each plasmid). VEGFR-3 promoter activity was normalized to total milligram of protein. Inset confirms lack of Prox1 in control HEK293 and forced expression in transfected cells. Activation of VEGFR-3 promoter by coexpression of p50 and Prox1 was compared with the effect on NF-κB–independent promoters for phosphoglycerate kinase (PGK) and ubiquitin C (UBC) examined under the same conditions. Data presented as the mean promoter activity ± SEM of 3 independent experiments performed in triplicate (total n = 9 per condition). (F) Prox1-negative blood vascular endothelial line, HULEC, was transfected with VEGFR-3−849/+55 promoter expression and pCMV-Flag-p50 or pCMV-Flag-p65 plasmids and cotransfected with pCMV-Prox1 or empty vector, as described in panel E. The analysis of the VEGFR-3 promoter activity was performed as described in panel E. Data are presented as the mean VEGFR-3 promoter activity ± SEM derived from 3 independent experiments performed in quadruplicate (total n = 12 per condition). (G) Fold activation of the full-length (−849/+55 bp) and truncated (−118/+55 bp) VEGFR-3 promoters was compared after cotransfection with pCMV-Prox1, pCMV-Flag-p50, and pCMV-Flag-p65 alone or in combination as described in panel E. Data are presented as the mean VEGFR-3 promoter activity ± SEM derived from 3 independent experiments. *P < .05, **P < .01, and ***P < .001 versus control, as determined by Student unpaired t test.

References

    1. Swartz MA, Hubbell JA, Reddy ST. Lymphatic drainage function and its immunological implications: from dendritic cell homing to vaccine design. Semin Immunol. 2008;20(2):147–156. - PubMed
    1. Shin WS, Rockson SG. Animal models for the molecular and mechanistic study of lymphatic biology and disease. Ann N Y Acad Sci. 2008;1131:50–74. - PubMed
    1. Jamieson T, Cook DN, Nibbs RJ, et al. The chemokine receptor D6 limits the inflammatory response in vivo. Nat Immunol. 2005;6(4):403–411. - PubMed
    1. Achen MG, Stacker SA. Molecular control of lymphatic metastasis. Ann N Y Acad Sci. 2008;1131:225–234. - PubMed
    1. Veikkola T, Jussila L, Makinen T, et al. Signalling via vascular endothelial growth factor receptor-3 is sufficient for lymphangiogenesis in transgenic mice. EMBO J. 2001;20(6):1223–1231. - PMC - PubMed

Publication types

MeSH terms

Substances