. 2010 Oct;43(4):475-86.
doi: 10.1165/rcmb.2009-0039OC. Epub 2009 Nov 9.

Effects of age on the synergistic interactions between lipopolysaccharide and mechanical ventilation in mice

Affiliations

Effects of age on the synergistic interactions between lipopolysaccharide and mechanical ventilation in mice

Lincoln S Smith et al. Am J Respir Cell Mol Biol. 2010 Oct.

Abstract

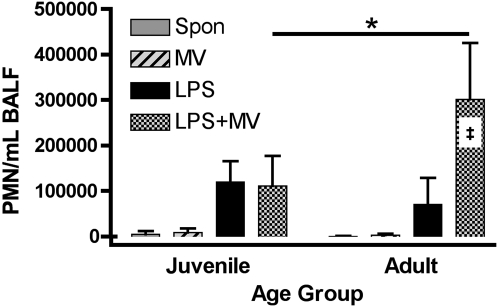
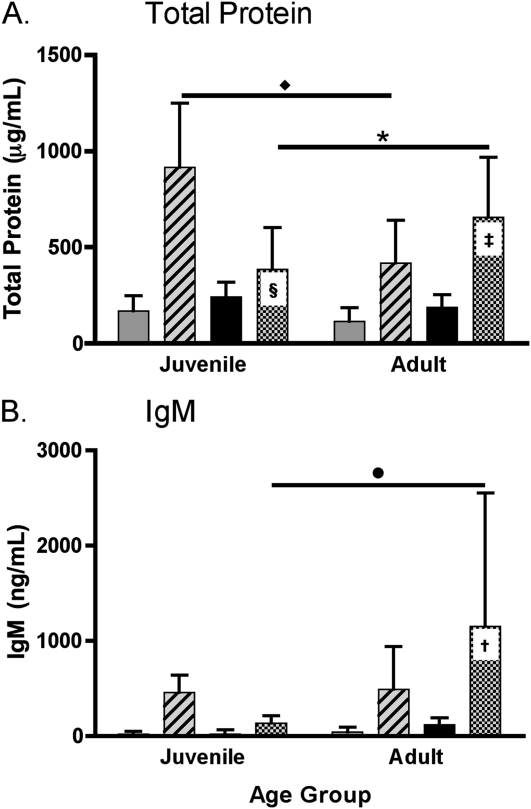
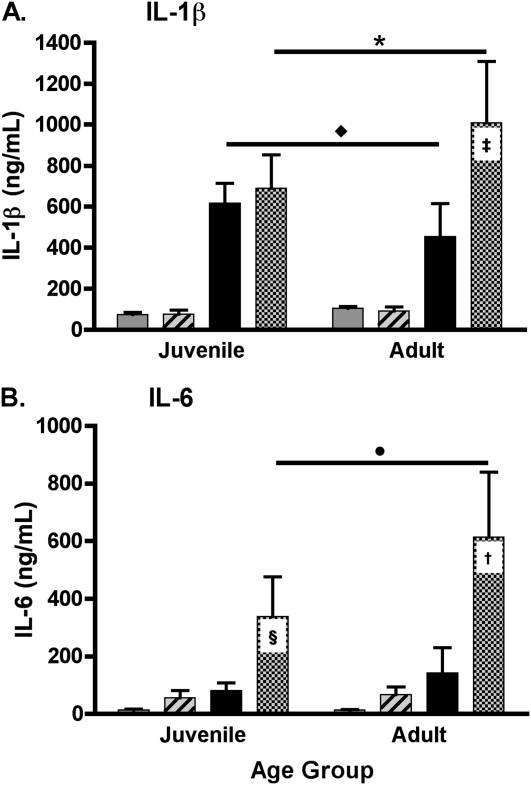
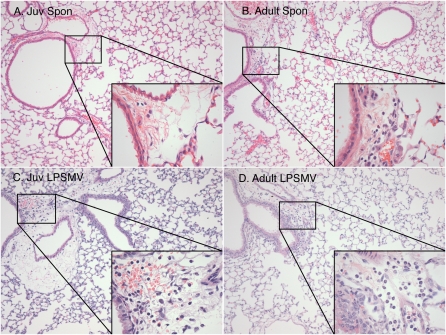
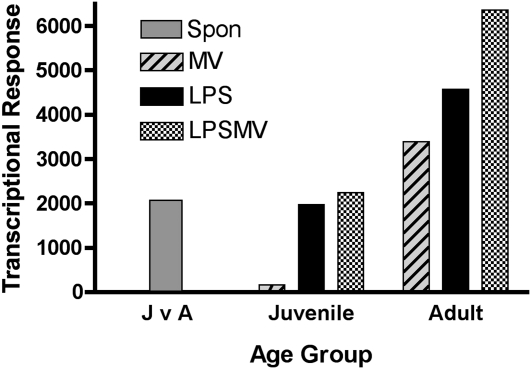
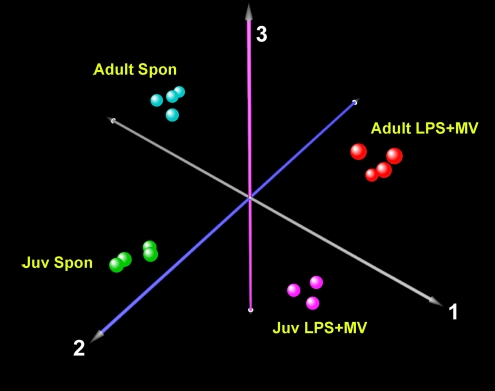
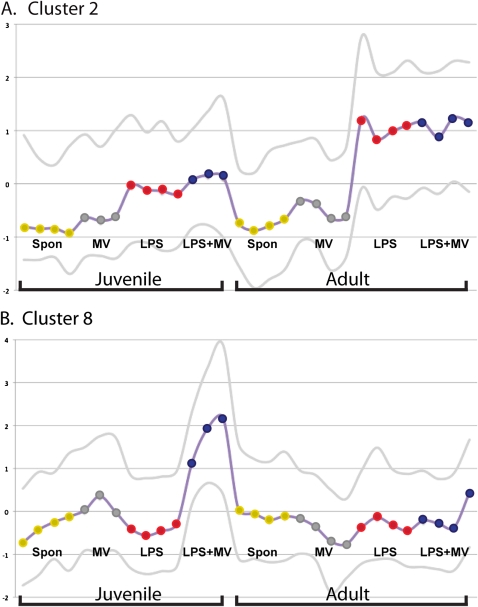
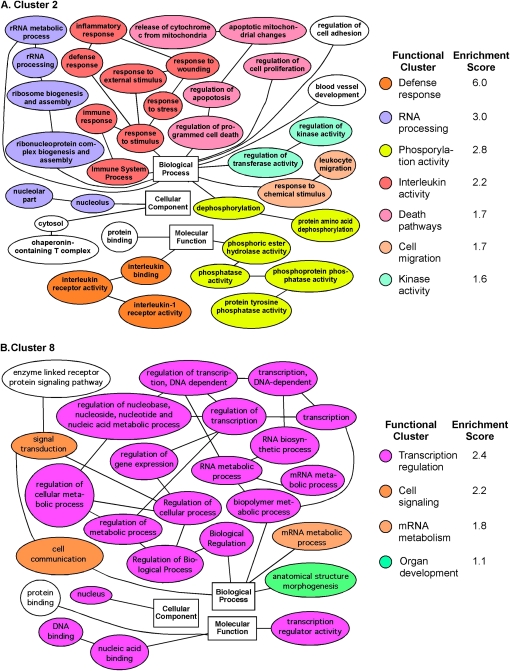
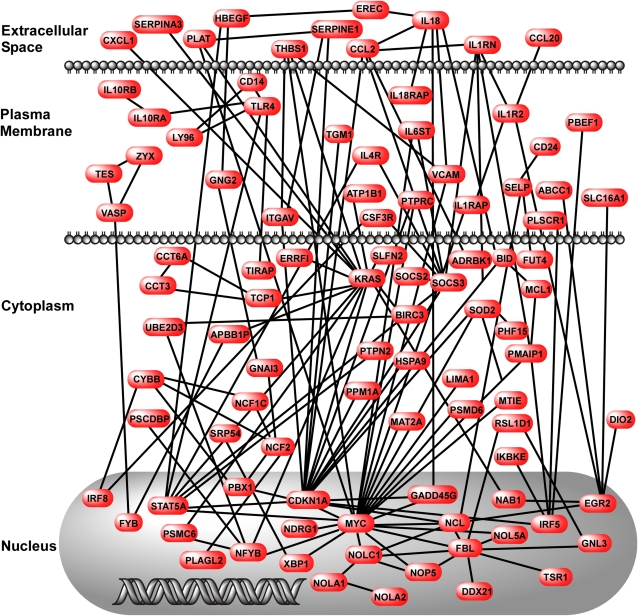
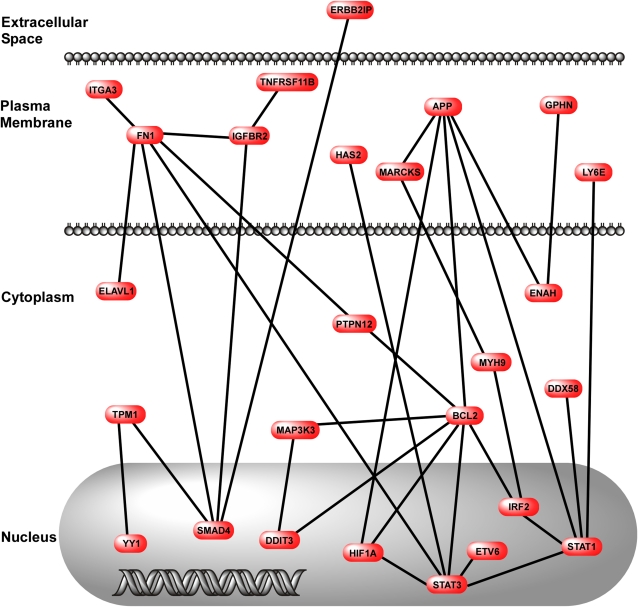
Children have a lower incidence and mortality from acute lung injury (ALI) than adults, and infections are the most common event associated with ALI. To study the effects of age on susceptibility to ALI, we investigated the responses to microbial products combined with mechanical ventilation (MV) in juvenile (21-d-old) and adult (16-wk-old) mice. Juvenile and adult C57BL/6 mice were treated with inhaled Escherichia coli 0111:B4 lipopolysaccharide (LPS) and MV using tidal volume = 15 ml/kg. Comparison groups included mice treated with LPS or MV alone and untreated age-matched control mice. In adult animals treated for 3 hours, LPS plus MV caused synergistic increases in neutrophils (P < 0.01) and IgM in bronchoalveolar lavage fluid (P = 0.03) and IL-1β in whole lung homogenates (P < 0.01) as compared with either modality alone. Although juvenile and adult mice had similar responses to LPS or MV alone, the synergistic interactions between LPS and MV did not occur in juvenile mice. Computational analysis of gene expression array data suggest that the acquisition of synergy with increasing age results, in part, from the loss of antiapoptotic responses and the acquisition of proinflammatory responses to the combination of LPS and MV. These data suggest that the synergistic inflammatory and injury responses to inhaled LPS combined with MV are acquired with age as a result of coordinated changes in gene expression of inflammatory, apoptotic, and TGF-β pathways.


Figures

Figure 1.
Figure 1.
Effect of lipopolysaccharide (LPS) + mechanical ventilation (MV) on polymorphonuclear neutrophils (PMNs) in bronchoalveolar lavage fluid. PMNs were measured in the BALF from adult and juvenile mice treated with inhaled LPS, MV, and LPS+MV. Values are the mean ± SD (n ≥ 12 per group). Synergy between LPS and MV in adult mice (P = 2.1 × 10⁻¹⁴), and the horizontal bar indicates the effect of age on the PMN responses to LPS+MV (*P = 8.2 × 10⁻¹⁰).
Figure 2.
Figure 2.
Effect of LPS+MV on alveolar permeability. (A) Total protein and (B) IgM were measured in the bronchoalveolar lavage fluid from adult and juvenile mice treated with inhaled LPS, MV, and LPS+MV. Values are mean ± SD (n = 10 per group). Additive effect of LPS and MV in adult mice (P = 0.13). §Significant decrease in protein in juvenile mice treated with LPS+MV as compared with the effects of LPS or MV alone (P = 5.3 × 10⁻⁹). Asterisk and diamond indicate the effects of age on the responses to MV and LPS+MV, respectively (P = 6.0 × 10⁻⁷ and P = 1.1 × 10⁻⁵). Synergism between LPS and MV in adult mice (P = 0.030). The circle indicates the effect of age on the response to LPS+MV (P = 0.011).
Figure 3.
Figure 3.
Effect of LPS+MV on cytokines in the lungs. (A) IL-1β and (B) IL-6 were measured in whole lung homogenates of adult and juvenile mice treated with inhaled LPS, MV, and LPS+MV. Values are the mean ± SD (n = 10 per group). and , Synergy between LPS and MV in adult mice (P = 9.4 × 10⁻¹⁰ and P = 4.0 × 10⁻⁹). §Synergy between LPS and MV in juvenile mice (P = 9.0 × 10⁻⁴). Asterisk and circle indicate the effects of age on the responses to LPS+MV (P = 2.2 × 10⁻⁵ and P = 0.023). Diamond indicates the effect of age on the response to LPS (P = 9.2 × 10⁻⁶).
Figure 4.
Figure 4.
Effect of LPS+MV on lung histopathology of juvenile and adult mice. Photomicrographs were taken at ×20 and ×60 (inset) of untreated (A) juvenile and (B) adult mice and compared with (C) juvenile and (D) adult mice treated with LPS+MV (n = 5 per group).
Figure 5.
Figure 5.
Effect of LPS+MV on global gene expression in mouse lungs. J v A = the number of differentially expressed genes in lungs of untreated, spontaneously breathing (Spon) juvenile versus adult mice (shaded bar). The effects of MV (hatched bar), LPS (solid bar), and LPS+MV (checked bar) on gene expression in the lungs of juvenile and adult mice were compared with age-matched untreated control mice.
Figure 6.
Figure 6.
Principal component analysis of gene expression responses of adult and juvenile mice treated with LPS+MV. The first three principal components of gene expression in the lungs of juvenile and adult mice show the effect of age and treatment on the variability of gene expression. For clarity, only four age and treatment groups are shown. Each data point shows microarray data from one mouse.
Figure 7.
Figure 7.
K-median cluster analysis of the two-way ANOVA results in two different clusters. (A) Cluster 2, containing 387 genes that were increased in expression only in adult mice treated with LPS or LPS+MV. (B) Cluster 8, containing 248 genes that were increased in expression only in juvenile mice treated with LPS+MV. The horizontal axis represents individual mice (also shown as colored dots on the median line). The vertical axis is the median expression of the genes in the individual mice. The lower and upper lines show the 5th and 95th percentiles, respectively.
Figure 8.
Figure 8.
Gene ontology relationships of functionally enriched genes in (A) cluster 2 and (B) cluster 8. In each panel, the color groups show functionally related groups of genes.
Figure 9.
Figure 9.
Network map of genes in cluster 2. The map was created using genes identified in cluster 2 and published information about gene–gene interactions. The interactions were drawn with respect to the cellular location of the gene product.
Figure 10.
Figure 10.
Network map of genes in cluster 8. The map was created using genes identified in cluster 8 and published information about gene–gene interactions. The interactions were drawn with respect to the cellular location of the gene product.

References

    1. Rubenfeld GD, Caldwell E, Peabody E, Weaver J, Martin DP, Neff M, Stern EJ, Hudson LD. Incidence and outcomes of acute lung injury. N Engl J Med 2005;353:1685–1693. - PubMed
    1. ARDSNet. Ventilation with lower tidal volumes as compared with traditional tidal volumes for acute lung injury and the acute respiratory distress syndrome. N Engl J Med 2000;342:1301–1308. - PubMed
    1. Flori HR, Glidden DV, Rutherford GW, Matthay MA. Pediatric acute lung injury: prospective evaluation of risk factors associated with mortality. Am J Respir Crit Care Med 2005;171:995–1001. - PubMed
    1. Hudson LD, Milberg JA, Anardi D, Maunder RJ. Clinical risks for development of the acute respiratory distress syndrome. Am J Respir Crit Care Med 1995;151:293–301. - PubMed
    1. Martin TR, Rubenfeld GD, Ruzinski JT, Goodman RB, Steinberg KP, Leturcq DJ, Moriarty AM, Raghu G, Baughman RP, Hudson LD. Relationship between soluble cd14, lipopolysaccharide binding protein, and the alveolar inflammatory response in patients with acute respiratory distress syndrome. Am J Respir Crit Care Med 1997;155:937–944. - PubMed

Publication types

MeSH terms