. 2010 Jan;90(1):31-9.
doi: 10.1038/labinvest.2009.116. Epub 2009 Nov 9.

Pancreatic duodenal homeobox 1 protein is a novel beta-cell-specific autoantigen for type I diabetes

Affiliations

Pancreatic duodenal homeobox 1 protein is a novel beta-cell-specific autoantigen for type I diabetes

Shi-Wu Li et al. Lab Invest. 2010 Jan.

Abstract

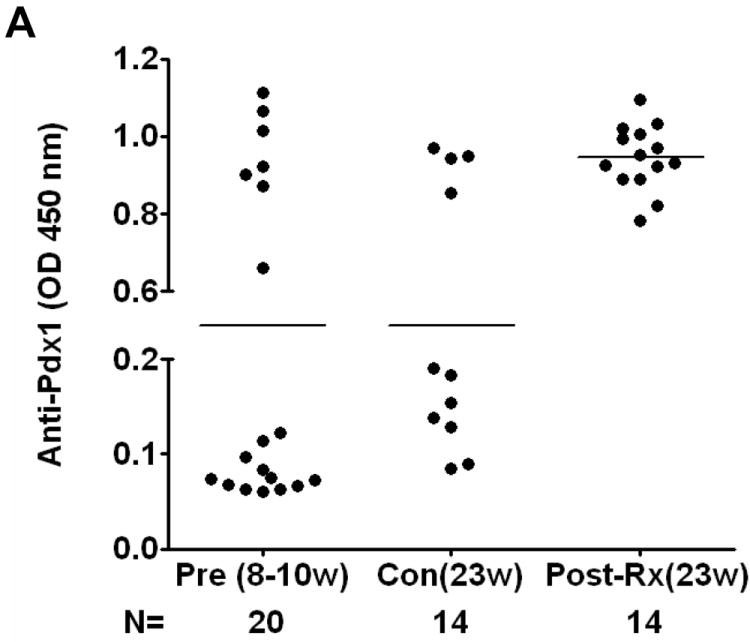
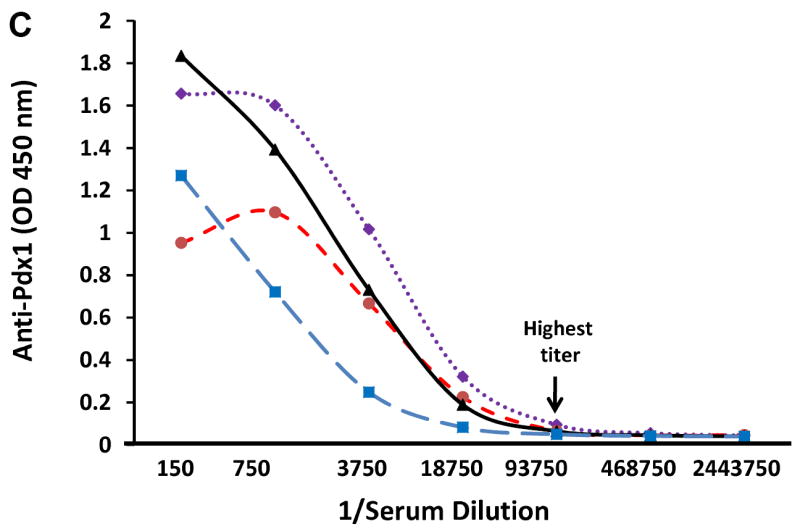
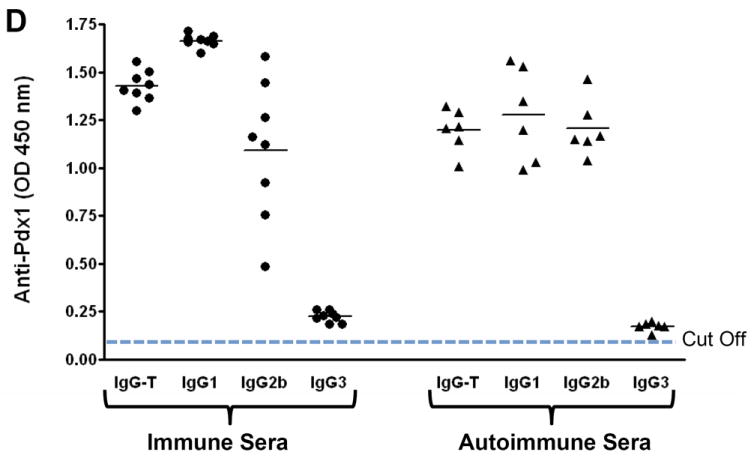
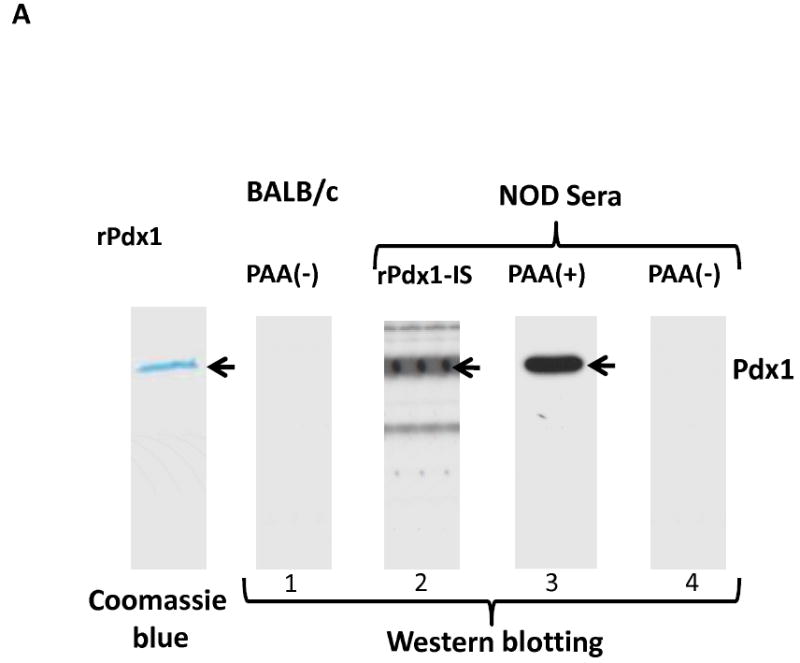
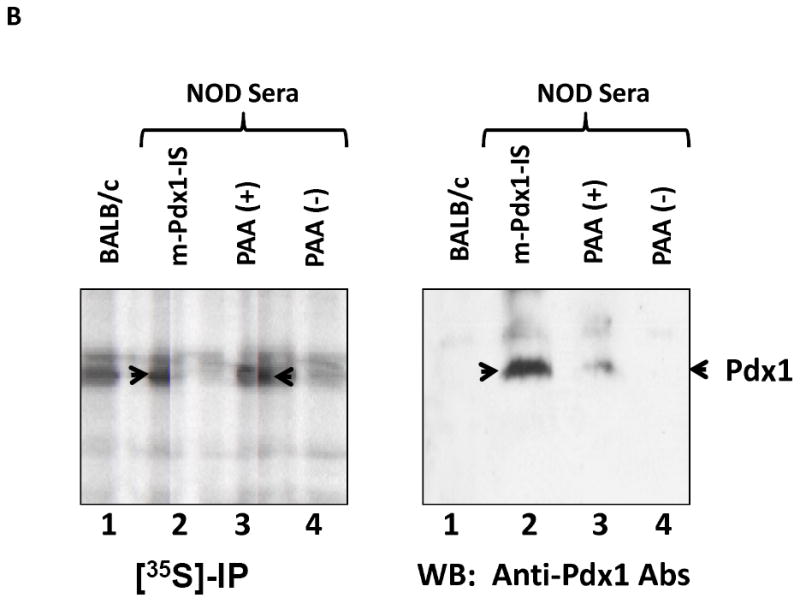
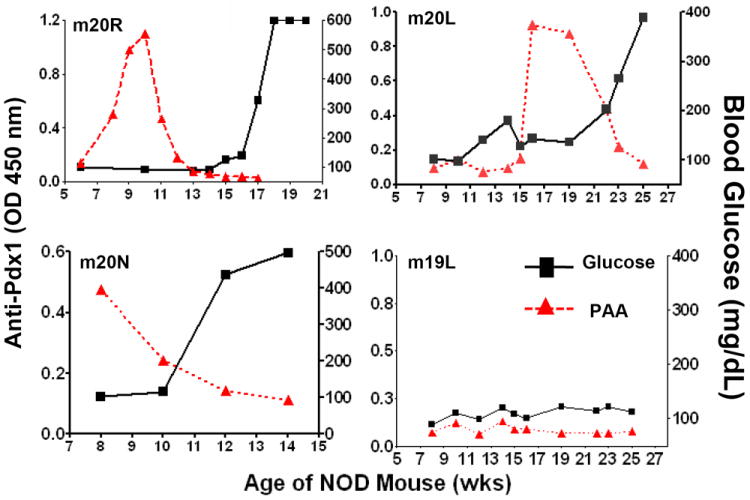
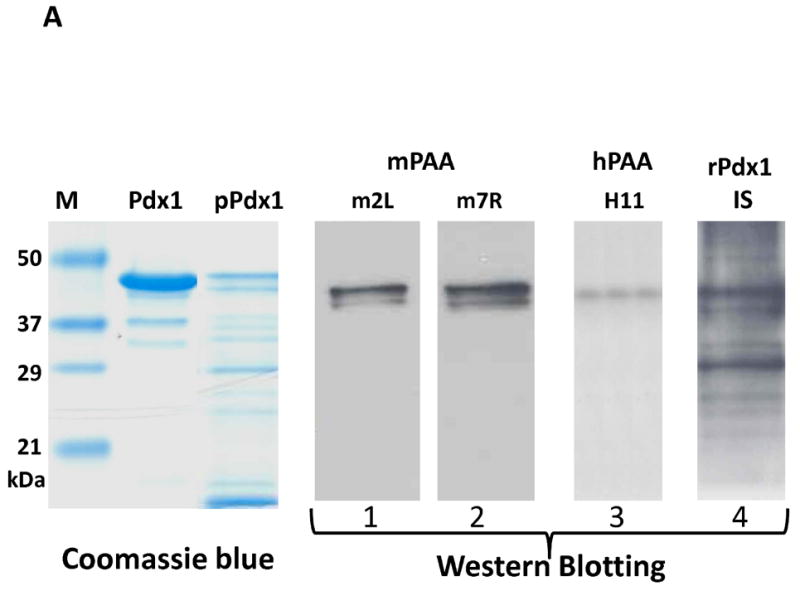
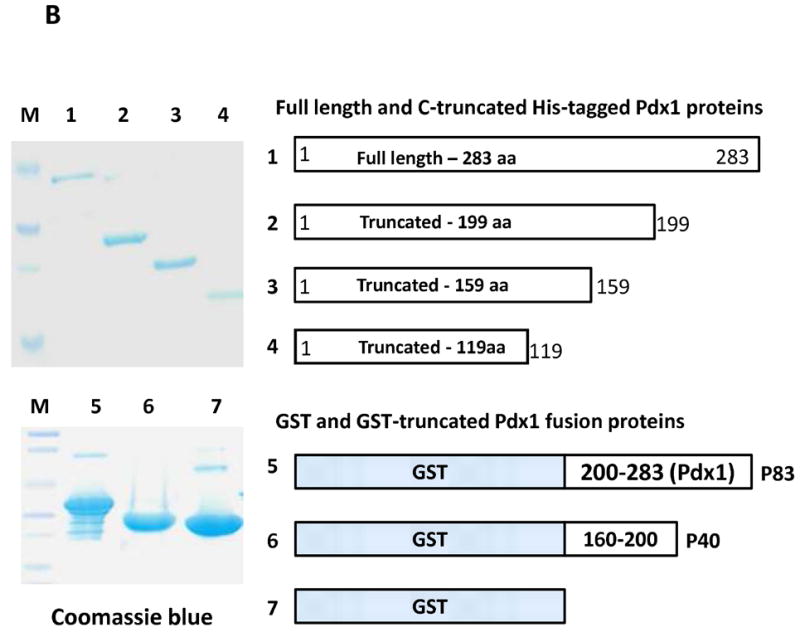
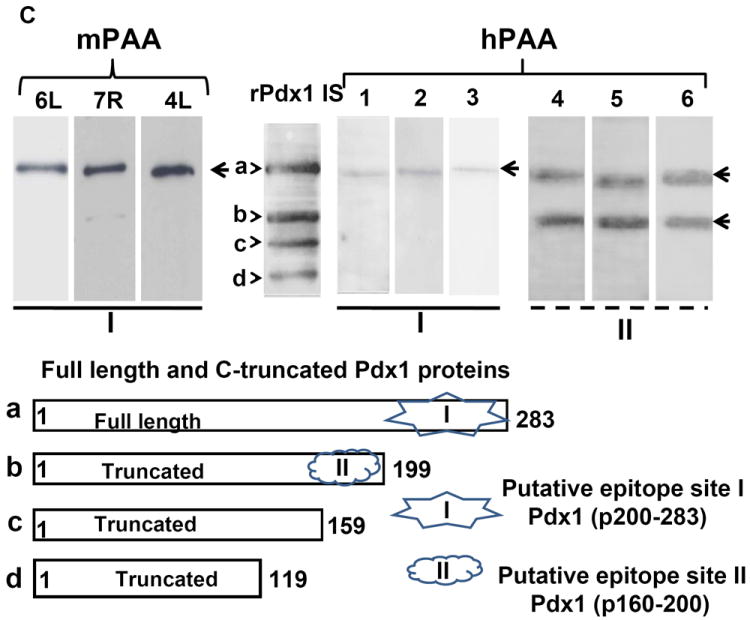
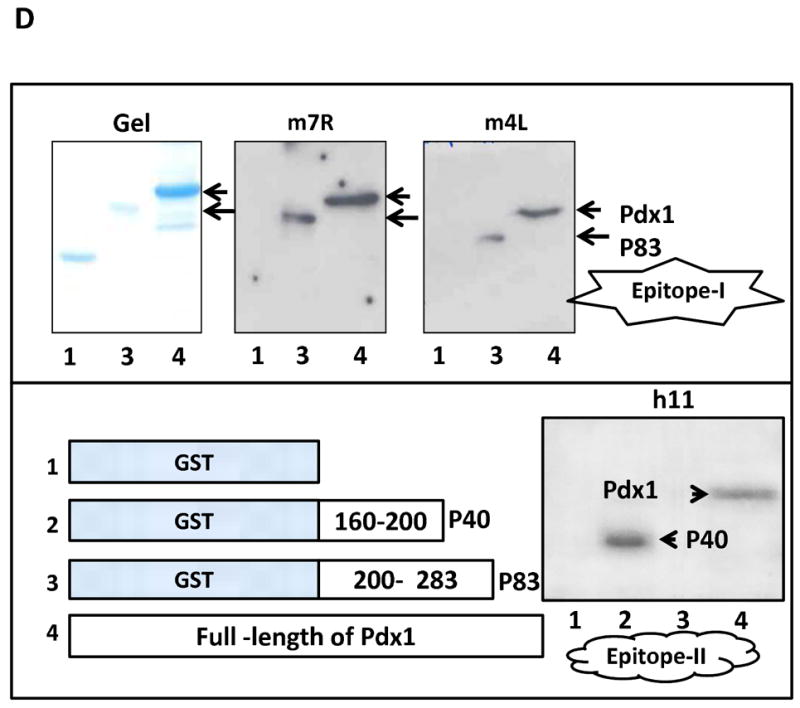
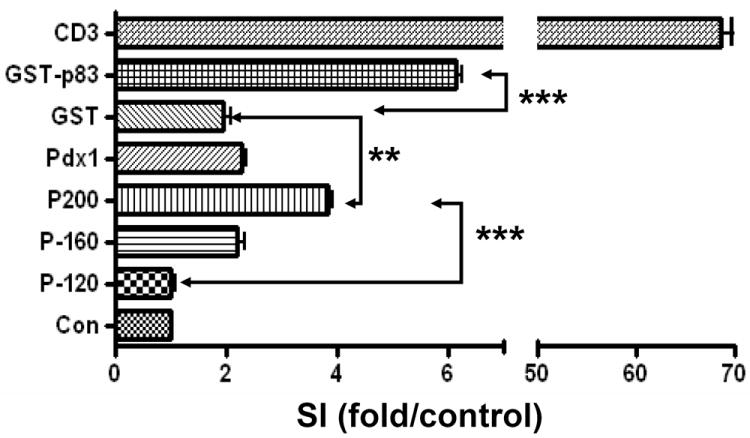
Pancreatic duodenal homeobox 1 (Pdx1) protein is a key transcription factor involved in the regulation of insulin gene expression that is expressed at high levels in the beta-cells of the pancreatic islets. We asked whether Pdx1 is a target of anti-islet autoimmunity in type I diabetes (T1D). Pdx1 autoantibodies (PAAs) were detected in non-obese diabetic (NOD) mice using ELISA, western blotting, and radioimmunoprecipitation of [(35)S]-labeled insulinoma cell line-derived Pdx1 protein. PAAs were detected as early as at 5 weeks of age, and generally peaked before the onset of clinically overt diabetes in diabetes-prone female NOD mice. Levels declined substantially after the onset of diabetes. PAAs were not detected in the sera of NOD-scid, C57BL/6, or BALB/c mice. The titers of PAAs in NOD mouse sera were as high as 1/93 750 by ELISA. The fine specificity of PAAs was determined by western blotting using a series of truncated recombinant Pdx1 proteins. The immunodominant epitopes were located to the C-terminus of the Pdx1 (p200-283) in NOD mice. PAAs also were detected in sera from human T1D patients, but the major epitopes were localized to amino acids 159-200 as well as the same region (p200-283) recognized by PAAs from NOD mice. Using [(3)H]thymidine incorporation, the p83 fragment of Pdx1 specifically stimulated proliferation of splenic T cells from recent-onset diabetic NOD mice. The presence of PAAs in prediabetic NOD mice and human T1D patients, and Pdx1-specific T-cell proliferation in NOD mice provide a strong rationale for further investigation of the pathogenic role of immune responses against Pdx1 in T1D.


Figures

Fig. 1
Fig. 1. Pdx1 autoantibodies in prediabetic NOD mice
A. Detection of Pdx1 antibodies in NOD mice. Sera were collected from female NOD mice at various ages ranging from 8 to 23 weeks or NOD mice treated with daily injection of rPdx1 for 12 weeks. PAA were assayed using ELISA at a serum dilution of 1:30. Positive value is defined 3 SD above the mean of the BALB/c control sera. (Pre, pre-treatment; Con, PBS-treated controls; Post-Rx, treated with rPdx1). B. Comparison of PAA in various strains of mice. Sera from various mouse strains at different ages were collected and PAA were measured by ELISA and expressed as OD values at 450 nM using the 99th percentile of BALB/c control mice as the threshold definition of positivity. C. PAA titration curve. Selected PAA-positive serum samples at age of 10 weeks were serially diluted as indicated and OD values were determined by ELISA. Titer is defined as the last dilution giving positive OD reading above control. D. Isotypes of anti-Pdx1 antibodies. Total anti-Pdx1 antibody activity (IgG-T) and anti-Pdx1 antibodies of the IgG1, IgG2b, and IgG3 isotypes in sera from NOD mice immunized with Pdx1 (immune sera, solid circles) and selected PAA-positive autoimmune sera (triangle) from NOD mice were assayed by ELISA (1:30 dilution). An OD of 0.10 was used as the positive cut-off value (≥ 3 SD above the mean of the BALB/c control sera).
Fig. 2
Fig. 2. Confirmation of PAA by Western blot (A) and immpreprecipitation (B)
A. Western blotting. Purified recombinant rat Pdx1 protein (1 μg/lane) was separated on a 10% SDS-PAGE and stained with Coomassie blue or transferred to PVDF membrane. The membrane was probed with BALB/c or NOD mouse serum either positive (PAA+) or negative (PAA-) by ELISA, or with rabbit polyclonal anti-Pdx1 immune serum (rPdx1-IS) as positive control. B. Immunoprecipitation and Western blotting. Rat insulinoma cells (INS-1) were labeled with [35S]-methionine overnight and cell lysate (0.5 mg) was incubated for 1 hr at 4°C with preformed immune complexes by incubating 10 μl mouse serum with 50 μl protein A/G overnight at 4°C. 35S-labelled proteins were separated by SDS-PAGE, fluorographed, and the dried gel was exposed to X-ray film at -80°C for 7 days. In parallel, unlabeled INS-1 cell lysate was subjected to immunoprecipitation with the same mouse sera. The immune complexes were separated by SDS-PAGE, transferred to PVDF membrane, and probed with rabbit anti-Pdx1 polyclonal antibodies (1:2000). Lanes 1-BALB/c, 2- Pdx1-treated NOD mouse immune serum (m-Pdx1-IS), 3-PAA(+), and 4-PAA(-) NOD serum samples. Arrow indicates position of Pdx1 protein.
Fig. 3
Fig. 3. Relationship between PAA levels and onset of diabetes
Serum samples were collected biweekly from 5 week-old NOD mice (n = 20). PAA were detected by ELISA and expressed as OD values at 450 nM. Blood glucose levels were monitored weekly via tail vein snipping. Four representative mice (m20R, m20L, m20N, and m19L) are shown here.
Fig. 4
Fig. 4. Identification of immunodominant B-cell autoepitopes of Pdx1
A. Partial digestion of Pdx1 and Western blotting. Pdx1 protein was partially digested with trypsin at pH 7.6 25°C for 10 min, and the digested products were separated and stained with Coomassie blue (left panel) or transferred to the membrane for blotting with two PAA(+) mouse sera (m2L & m7R, Lanes 1, 2), human PAA+ serum (h11, lane 3), or rabbit polyclonal anti-Pdx1 immune serum (lane 4). B. Expression and purification of truncated Pdx1 proteins. Full length or truncated Pdx1 proteins with an N-terminal histidine-tag were prepared as described in Methods, separated by SDS-PAGE, and stained with Coomassie blue dye (upper panel). Lanes 1-full length, 2-Pdx1 (1-199), 3-Pdx1 (1-159), and 4-Pdx1 (1-119). Lower panel shows three purified proteins GST-Pdx1 (200-283) “p83”, GST-Pdx1 (160-200) “p40”, and GST that were separated by SDS-PAGE and stained with Coomassie blue. Lanes 5-p83, 6-p40, and 7-GST. C. Identification of two dominant epitope regions using a mixture of Pdx1 proteins. Four purified proteins, Pdx1 (a) and its truncated forms (b, c, & d), were mixed at equal concentrations and used for Western blotting to detect autoantibodies. Each lane was loaded with 5 μg of mixed proteins, resolved by SDS-PAGE, transferred to PVDF membrane, and probed using three mouse PAA (+) sera (6L, 7R, and 4L) at a dilution of 1:1500, or six human PAA (+) sera (Lanes 1-6) at a dilution of 1:200. Rabbit polyclonal anti-Pdx1 immune serum (rPdx1 IS) was used as positive control at a dilution of 1:2000. Arrows indicate full length Pdx1 (a) and truncated proteins (b, c, and d). Lower panel shows the structure of Pdx1 and its truncated forms and potential autoepitope regions I & II for mouse and human PAA. D. Confirmation of immunodominant autoepitopes. Upper left panel shows Coomassie blue staining of GST (lane 1), p83 (lane 2), and Pdx1 (lane 3). Right two panels are immunoblots using the same amount of proteins and blotted with two NOD mouse PAA (+) sera. Arrows indicate the positions of Pdx1 and p83. Lower left panel is a diagram of the four proteins (1-GST, 2-GST-p40, 3-GST-p83, and 4-Pdx1) used in this study. The lower right panel depicts an immunoblot using human h11 PAA (+) serum. Arrows indicate positions of corresponding proteins as indicated.
Fig. 5
Fig. 5. Antigen-specific T-cell proliferation to Pdx1 and its truncated forms
Splenocytes (106 cells/well) isolated from a NOD mouse with new onset diabetes were incubated in a 96-well plate. Pdx1 and various truncated proteins were added into the wells at a final concentration of 1 μg/ml for 48 hrs, following by adding [3H]-thymidine for an additional 24 hrs. Cells were captured on filter paper, washed 5 times, and [3H]-thymidine incorporation was determined by scintillation counting. Background count is without [3H]-thymidine. ** p <0.01, *** p < 0.001 (Student’s t-test). SI = Stimulation Index.

Comment in

Similar articles

Cited by

References

    1. Atkinson MA, Eisenbarth GS. Type 1 diabetes: new perspectives on disease pathogenesis and treatment. Lancet. 2001;358:221–229. - PubMed
    1. Wasserfall CH, Atkinson MA. Autoantibody markers for the diagnosis and prediction of type 1 diabetes. Autoimmun Rev. 2006;5:424–428. - PubMed
    1. Miao D, Yu L, Eisenbarth GS. Role of autoantibodies in type 1 diabetes. Front Biosci. 2007;12:1889–1898. - PubMed
    1. Pihoker C, Gilliam LK, Hampe CS, Lernmark A. Autoantibodies in diabetes. Diabetes. 2005;54(Suppl 2):S52–S61. - PubMed
    1. Skyler JS. Prediction and prevention of type 1 diabetes: progress, problems, and prospects. Clin Pharmacol Ther. 2007;81:768–771. - PubMed

Publication types

MeSH terms