. 2010 Jan;90(1):128-39.
doi: 10.1038/labinvest.2009.119. Epub 2009 Nov 9.

Plasma concentrations of inflammatory cytokines rise rapidly during ECMO-related SIRS due to the release of preformed stores in the intestine

Affiliations

Plasma concentrations of inflammatory cytokines rise rapidly during ECMO-related SIRS due to the release of preformed stores in the intestine

R Britt McILwain et al. Lab Invest. 2010 Jan.

Abstract

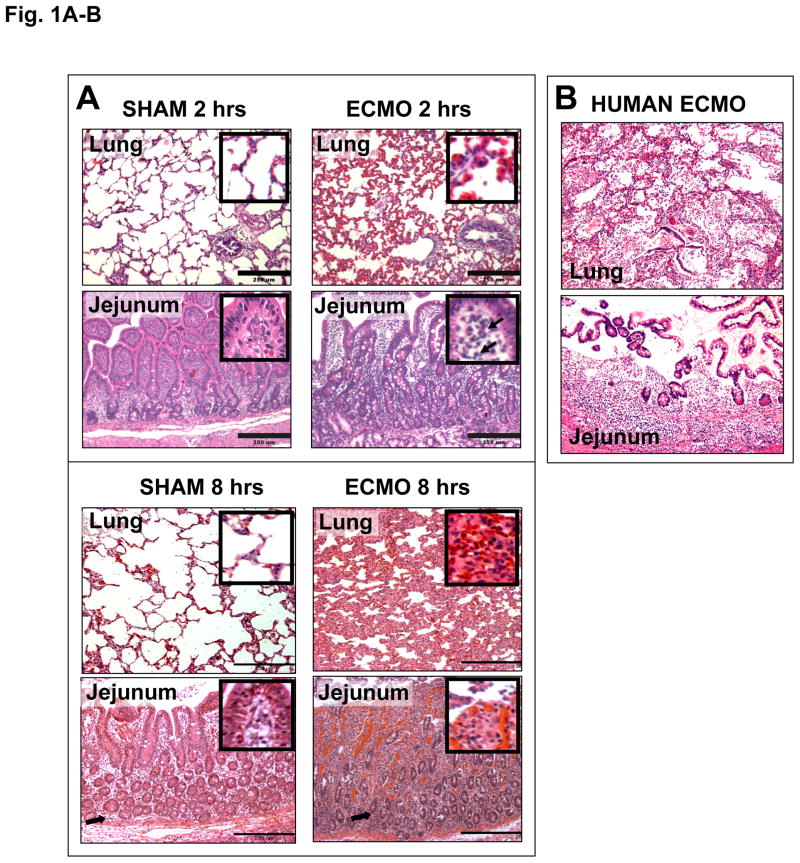
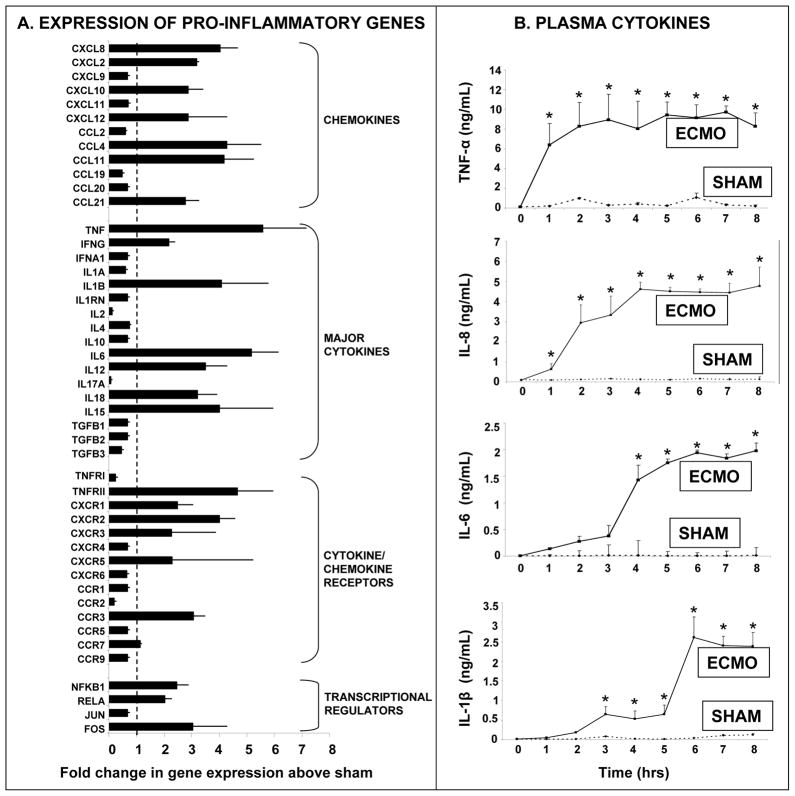
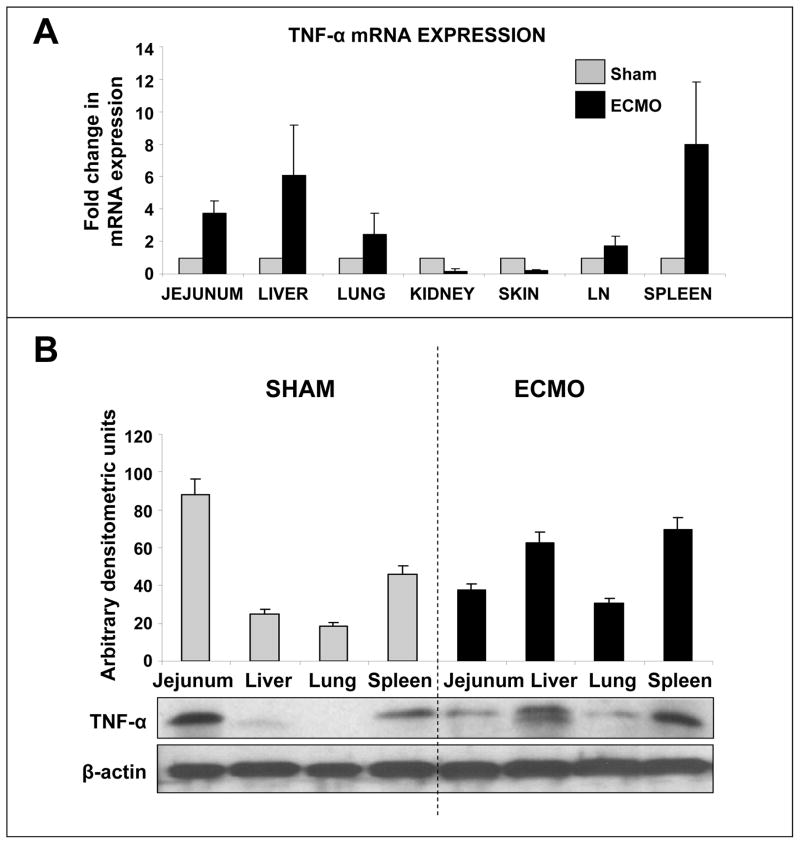
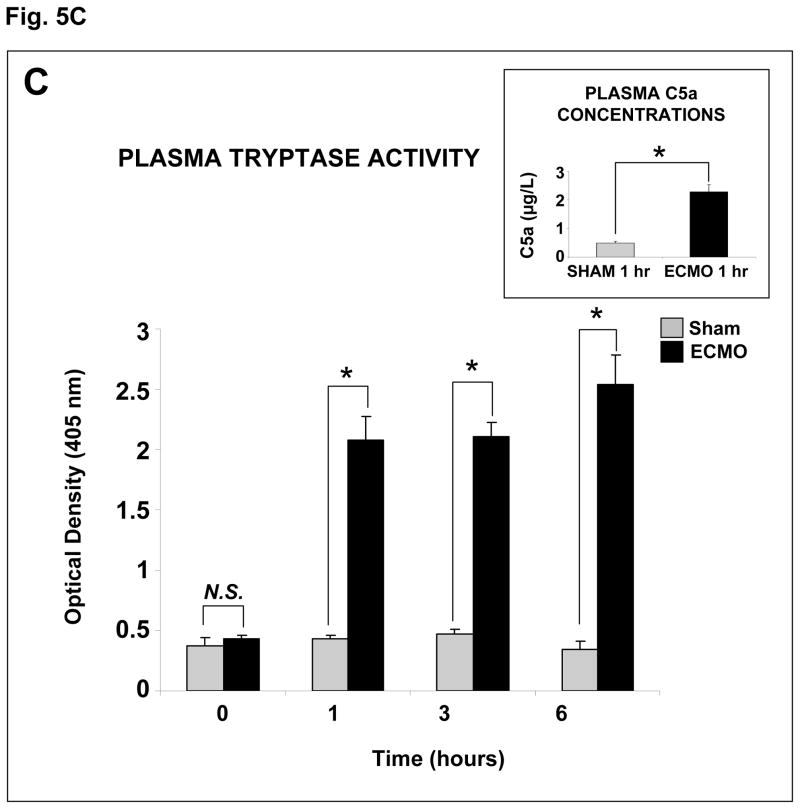
Extracorporeal membrane oxygenation (ECMO) is a life-saving support system used in neonates and young children with severe cardiorespiratory failure. Although ECMO has reduced mortality in these critically ill patients, almost all patients treated with ECMO develop a systemic inflammatory response syndrome (SIRS) characterized by a 'cytokine storm', leukocyte activation, and multisystem organ dysfunction. We used a neonatal porcine model of ECMO to investigate whether rising plasma concentrations of inflammatory cytokines during ECMO reflect de novo synthesis of these mediators in inflamed tissues, and therefore, can be used to assess the severity of ECMO-related SIRS. Previously healthy piglets (3-week-old) were subjected to venoarterial ECMO for up to 8 h. SIRS was assessed by histopathological analysis, measurement of neutrophil activation (flow cytometry), plasma cytokine concentrations (enzyme immunoassays), and tissue expression of inflammatory genes (PCR/western blots). Mast cell degranulation was investigated by measurement of plasma tryptase activity. Porcine neonatal ECMO was associated with systemic inflammatory changes similar to those seen in human neonates. Tumor necrosis factor-alpha (TNF-alpha) and interleukin-8 (IL-8) concentrations rose rapidly during the first 2 h of ECMO, faster than the tissue expression of these cytokines. ECMO was associated with increased plasma mast cell tryptase activity, indicating that increased plasma concentrations of inflammatory cytokines during ECMO may result from mast cell degranulation and associated release of preformed cytokines stored in mast cells. TNF-alpha and IL-8 concentrations rose faster in plasma than in the peripheral tissues during ECMO, indicating that rising plasma levels of these cytokines immediately after the initiation of ECMO may not reflect increasing tissue synthesis of these cytokines. Mobilization of preformed cellular stores of inflammatory cytokines such as in mucosal mast cells may have an important pathophysiological role in ECMO-related SIRS.


Conflict of interest statement

Disclosures: No conflicts of interest to disclose.

Figures

Fig. 1
Fig. 1. Histopathological changes of inflammation during ECMO
A. H&E-stained sections from the lung and the intestine (jejunum) after 2 and 8 hours of ECMO. Upper panel: Histopathological changes after 2 hours of ECMO. Photomicrographs (magnification 100×) highlight the differences between the near-normal alveolar histoarchitecture in sham animals vs. the conspicuous leukocyte infiltration and focal hemorrhages in ECMO. In the intestine, ECMO caused an increase in cellularity in the lamina propria (low-magnification), which was due to leukocyte infiltration (higher magnification inset). Data represents n = 3 animals in both groups. Lower panel: Histopathological changes after 8 hours of ECMO. Inflammatory changes in the lung became worse with increased leukocyte infiltration, hemorrhages, and septal edema. In the intestine, there was an increase in leukocyte infiltration (black arrows) and focal hemorrhages. The epithelium was disrupted (magnification 100×). Insets shows high-magnification photomicrographs (400×) highlighting the inflammatory changes. Data represents n = 5 animals in both groups. B. Photomicrographs of lung and jejunum from human neonates who died during ECMO, showing the marked similarity between inflammatory changes in our porcine model and human tissues. Upper panel shows the effect of ECMO on the lung, including leukocyte infiltration and alveolar hemorrhages. Lower panel shows marked leukocyte infiltration and disruption of the epithelium in the intestine. Data represent 3 neonates. C. Neutrophil activation during neonatal porcine ECMO. Representative FACS histograms from sham and ECMO animals drawn after 2 hours of treatment show increased expression of activation markers CD18, CD35, CD62L, and CD11b on circulating neutrophils during ECMO. Bar diagrams shown below the FACS panels summarize the information from an n =5 in both groups. Data were analyzed by the Mann-Whitney U test. * indicates a significant difference between ECMO and sham groups, p<0.05.
Fig. 2
Fig. 2. ‘Global’ activation of inflammatory mediators in lung tissue during porcine neonatal ECMO
A. Real-time PCR microarray profiles mRNA expression of various pro-inflammatory genes in the lung after 8 hours of ECMO emphasize the ‘global’ activation of inflammatory mediators during ECMO. Data represent an n =5 animals in both sham and ECMO groups and are depicted as mean ± SEM fold change above sham (dashed line). Gene expression profiles in the intestine were generally similar to those in the lung (not depicted). B. Increased plasma concentrations of pro-inflammatory cytokines TNF-α, IL-8/CXCL8, IL-6, and IL-1β as measured by ELISA. Line diagrams depict cytokine concentrations (n=5 animals in sham and ECMO group; means ± SEM). * indicates a significant difference between ECMO and sham groups, p<0.05. Data were analyzed by the repeated measures ANOVA on ranks.
Fig. 3
Fig. 3. Onset of systemic inflammatory response during ECMO was not reflected in plasma C-reactive protein concentrations during ECMO
Unlike the marked changes seen in plasma cytokine concentrations, we did not detect significant changes in plasma CRP in the initial 8 hours of ECMO. Other acute phase reactants such as leukocyte counts were also not discriminatory (not depicted). Line diagrams (means ± SEM) summarize information from 5 animals each in ECMO and sham groups. Data were analyzed by the repeated measures ANOVA on ranks.
Fig. 4
Fig. 4. Rapid rise in plasma TNF-α concentrations during ECMO is not matched by increased synthesis of TNF-α protein in the tissues
We harvested intestine, liver, lung, kidney, skin, mesenteric lymph nodes, and the spleen after 2 hours of ECMO. While the mRNA expression for TNF-α was increased as anticipated, we did not detect an increase in TNF-α protein proportionate to the increase in plasma TNF-α concentrations. A. Bar diagrams show the fold-change (means ± SEM) in TNF-α mRNA as measured by real-time PCR after 2 hours of treatment. Data represents an n=3 animals in sham and ECMO groups. B. Western blots for porcine TNF-α and β-actin on tissue samples from the intestine, liver, lung, and spleen (the four tissues with the greatest increase in expression of TNF-α mRNA above). Bar diagrams show the densitometric analysis (means ± SEM) of these bands. Data are representative of 3 animals in each group.
Fig. 5
Fig. 5
A. Mast cells in the sham/ECMO porcine intestine contain pre-formed TNF-α: Immunofluorescence photomicrographs (1000×) from the intestine show strong TNF-α immunoreactivity in c-kit/CD117+ mast cells in both sham animals and after 2 hours of ECMO. TNF-α immunoreactivity was slightly weaker in ECMO animals than in the sham group, consistent with our findings of mast cell degranulation during ECMO. Data representative of 3–5 stained sections from different animals in both sham and ECMO groups. B. Similar co-localization of c-kit and TNF-α seen in archived autopsy tissues from human neonates who died during ECMO. Data represents 3 different neonates. C. Porcine neonatal ECMO was associated with degranulation of mast cells: Bar diagrams (means ± SEM) show plasma tryptase activity in sham and ECMO animals as a function of time. Plasma tryptase activity was significantly increased after 1 hour of ECMO, indicating that ECMO was associated with mast cell degranulation. Data summarize information from an n =5 animals in both sham and ECMO groups. Statistical comparisons were made by repeated measures ANOVA on ranks. * indicates a significant difference between ECMO and sham groups, p<0.05. Inset: Bar diagram (means ± SEM) shows that plasma samples after 1 hour of ECMO contained high levels of C5a, a potent mast cell secretagogue released during activation of the complement pathway. Data were analyzed by the Mann-Whitney U test. * indicates a significant difference between ECMO and sham groups, p<0.05.
Fig. 5
Fig. 5
A. Mast cells in the sham/ECMO porcine intestine contain pre-formed TNF-α: Immunofluorescence photomicrographs (1000×) from the intestine show strong TNF-α immunoreactivity in c-kit/CD117+ mast cells in both sham animals and after 2 hours of ECMO. TNF-α immunoreactivity was slightly weaker in ECMO animals than in the sham group, consistent with our findings of mast cell degranulation during ECMO. Data representative of 3–5 stained sections from different animals in both sham and ECMO groups. B. Similar co-localization of c-kit and TNF-α seen in archived autopsy tissues from human neonates who died during ECMO. Data represents 3 different neonates. C. Porcine neonatal ECMO was associated with degranulation of mast cells: Bar diagrams (means ± SEM) show plasma tryptase activity in sham and ECMO animals as a function of time. Plasma tryptase activity was significantly increased after 1 hour of ECMO, indicating that ECMO was associated with mast cell degranulation. Data summarize information from an n =5 animals in both sham and ECMO groups. Statistical comparisons were made by repeated measures ANOVA on ranks. * indicates a significant difference between ECMO and sham groups, p<0.05. Inset: Bar diagram (means ± SEM) shows that plasma samples after 1 hour of ECMO contained high levels of C5a, a potent mast cell secretagogue released during activation of the complement pathway. Data were analyzed by the Mann-Whitney U test. * indicates a significant difference between ECMO and sham groups, p<0.05.

Similar articles

Cited by

References

    1. Kelly RE, Jr, Phillips JD, Foglia RP, Bjerke HS, Barcliff LT, Petrus L, et al. Pulmonary edema and fluid mobilization as determinants of the duration of ECMO support. J Pediatr Surg. 1991;26(9):1016–1022. - PubMed
    1. Ford JW. Neonatal ECMO: Current controversies and trends. Neonatal Netw. 2006;25(4):229–238. - PubMed
    1. Khoshbin E, Dux AE, Killer H, Sosnowski AW, Firmin RK, Peek GJ. A comparison of radiographic signs of pulmonary inflammation during ECMO between silicon and poly-methyl pentene oxygenators. Perfusion. 2007;22(1):15–21. - PubMed
    1. Butler J, Pathi VL, Paton RD, Logan RW, MacArthur KJ, Jamieson MP, et al. Acute-phase responses to cardiopulmonary bypass in children weighing less than 10 kilograms. Ann Thorac Surg. 1996;62(2):538–542. - PubMed
    1. Kozik DJ, Tweddell JS. Characterizing the inflammatory response to cardiopulmonary bypass in children. Ann Thorac Surg. 2006;81(6):S2347–2354. - PubMed

Publication types

MeSH terms