Comparative Study
. 2010 Mar;12(1):1-10.
doi: 10.1208/s12248-009-9155-7. Epub 2009 Nov 10.

Comparison of two pharmacodynamic transduction models for the analysis of tumor therapeutic responses in model systems

Affiliations
Comparative Study

Comparison of two pharmacodynamic transduction models for the analysis of tumor therapeutic responses in model systems

Jun Yang et al. AAPS J. 2010 Mar.

Abstract

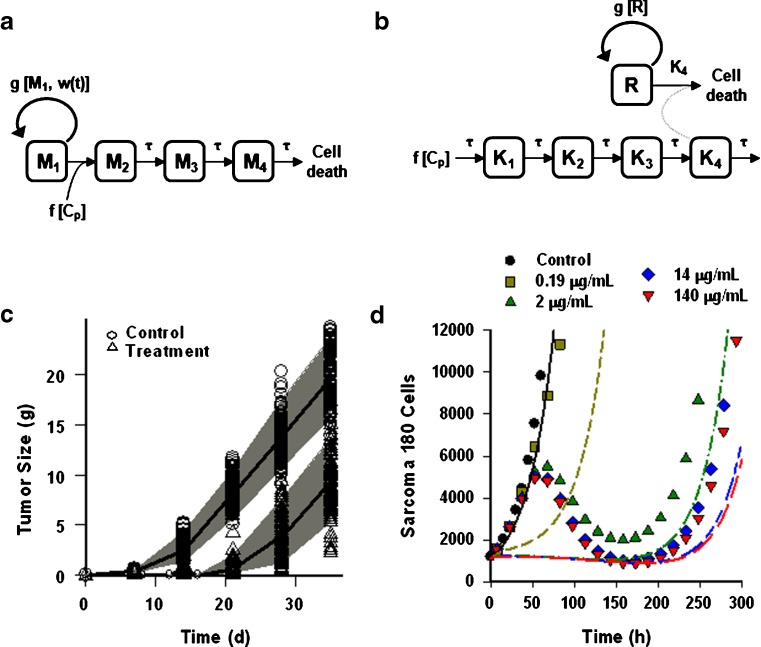
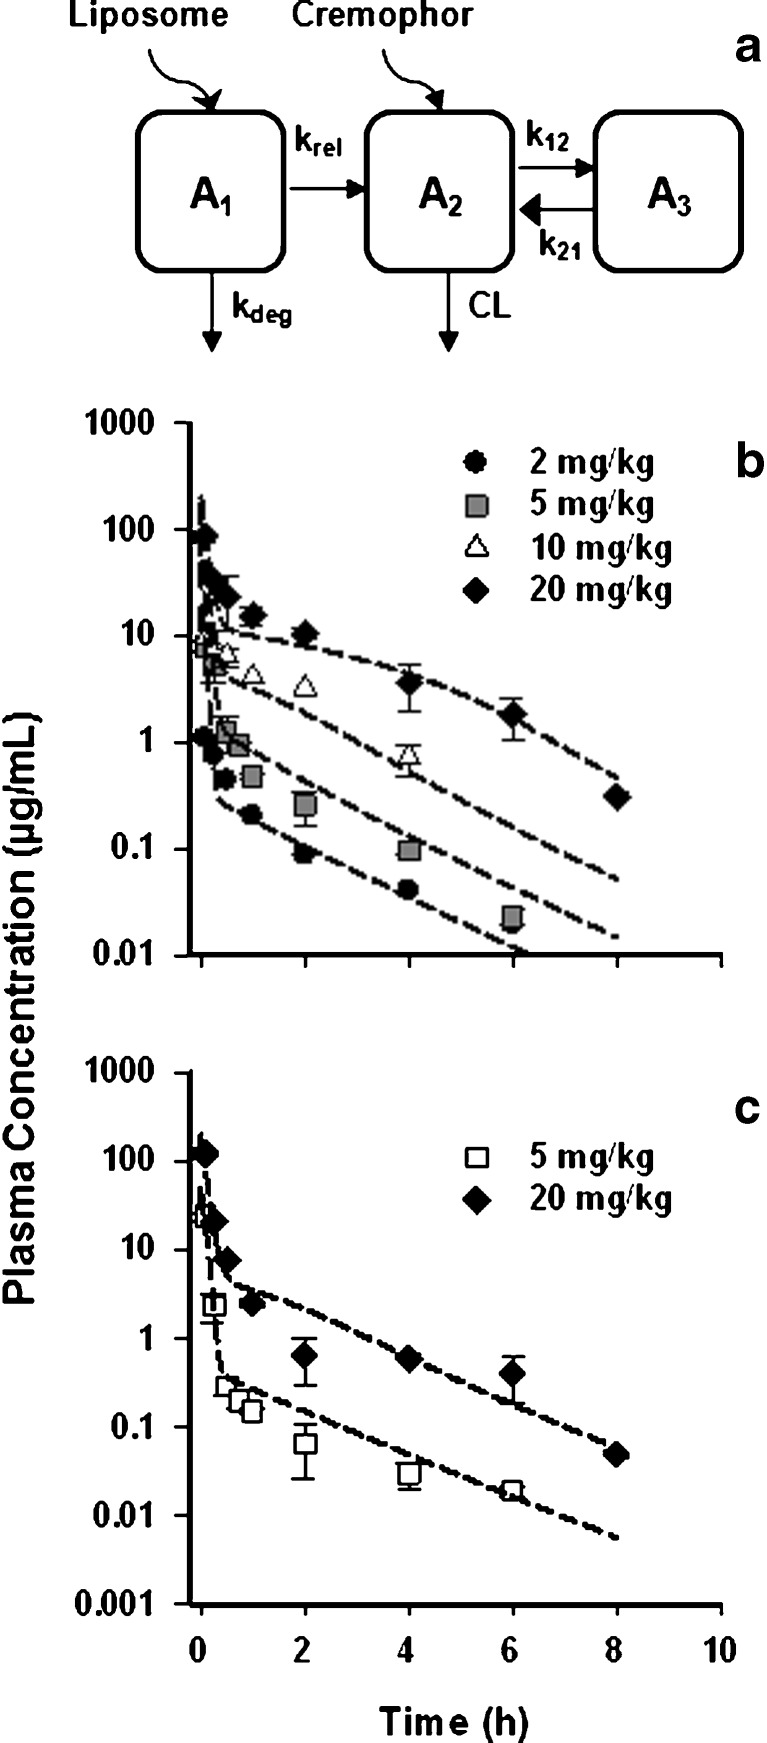
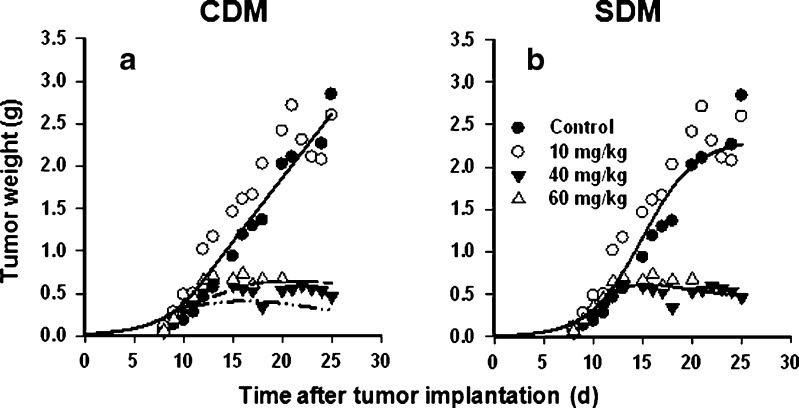
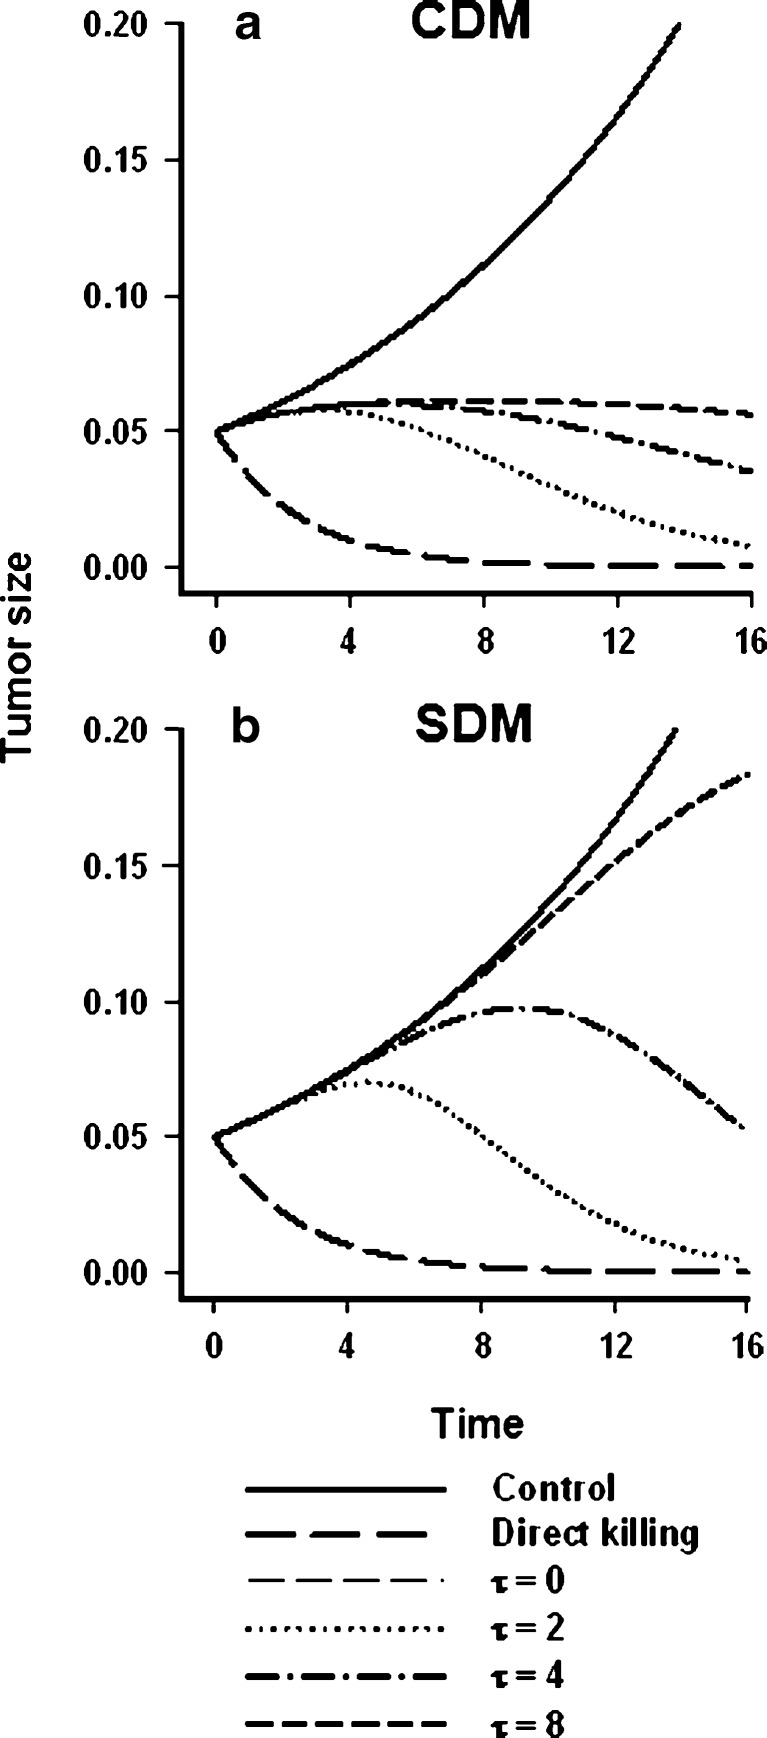
Semi-mechanistic pharmacodynamic (PD) models that capture tumor responses to anticancer agents with fidelity can provide valuable insights that could aid in the optimization of dosing regimens and the development of drug delivery strategies. This study evaluated the utility and potential interchangeability of two transduction-type PD models: a cell distribution model (CDM) and a signal distribution model (SDM). The evaluation was performed by simulating dense and sparse tumor response data with one model and analyzing it using the other. Performance was scored by visual inspection and precision of parameter estimation. Capture of tumor response data was also evaluated for a liposomal formulation of paclitaxel in the paclitaxel-resistant murine Colon-26 model. A suitable PK model was developed by simultaneous fitting of literature data for paclitaxel formulations in mice. Analysis of the simulated tumor response data revealed that the SDM was more flexible in describing delayed drug effects upon tumor volume progression. Dense and sparse data simulated using the CDM were fit very well by the SDM, but under some conditions, data simulated using the SDM were fitted poorly by the CDM. Although both models described the dose-dependent therapeutic responses of Colon-26 tumors, the fit by the SDM contained less bias. The CDM and SDM are both useful transduction models that recapitulate, with fidelity, delayed drug effects upon tumor growth. However, they are mechanistically distinct and not interchangeable. Both fit some types of tumor growth data well, but the SDM appeared more robust, particularly where experimental data are sparse.


Figures

Fig. 1
Fig. 1
Two transduction-type pharmacodynamic models to capture chemotherapeutic drug effects upon tumor cell volume. a Cell distribution model (CDM) described in (8); the action of drug is to transition a fraction of cycling cells into a transduction cascade that progresses to cell death and removal. b Signal distribution model (SDM) described in (9); drug interaction with a receptor initiates transduction of a pharmacological signal that propagates through a cascade, and the drug bio-signal ultimately results in the death of a fraction of the cycling cell population. a, b Symbols and abbreviations are defined in “THEORY”. c PD profile of the SDM fitted to a sparse data set (6 points) simulated with error and parameter variability by the CDM, using the original parameters reported (8) for fitting in vivo A2780 human ovarian tumor growth in animals that were untreated (“control”) or treated with 30 mg/kg Cre-pac (“treatment”). NONMEM was used for the fitting. Symbols represent simulated data points and lines represent mean predicted profiles. Shaded area shows the 95% confidence interval based on a 1,000-point Monte Carlo simulation. d PD profile of the CDM applied to a dense (1,000 points) data set simulated by the SDM without error or variability using the original parameters reported (9) for fitting the in vitro response of Sarcoma 180 cells to various concentrations of MTX over a 20-day period. Symbols represent simulated data points and lines represent the model fit: control, black solid line; 0.19 μg/mL, brown dash; 2 μg/mL, green dash-dot; 14 μg/mL, blue long-short-short dash; 140 μg/mL, red long-short dash. For clarity, symbols mark only one of every 50 data points
Fig. 2
Fig. 2
Pharmacokinetics of paclitaxel in Cremophor- or liposome-based formulations in mice. a Schematic of the pharmacokinetic model developed to fit data for the Cre-pac and L-pac formulations simultaneously. To accommodate the delayed release of drug from the liposome vehicle and clearance of the carrier by the RES before drug release, an additional compartment (A 1) was added. It was not necessary to include a drug release term for Cre-pac to obtain satisfactory model fits (RESULTS). b Plasma concentration profiles of Cre-pac and c L-pac formulations administered i.v. to mice. Symbols represent the data points digitized from the original publications (16,24,25). Lines represent the simultaneous fit of the PK model to data for both formulations
Fig. 3
Fig. 3
Model predictions of paclitaxel effects on colon tumor volume progression in mice. Data comparing the therapeutic efficacy of multiple i.v. doses of L-pac on s.c. Colon-26 tumors in mice were taken from the literature (15) and fit using the CDM and the SDM. Controls were treated with vehicle only. Symbols represent the data points, and lines represent the model fits to the data. Doses are as indicated in the figures. a CDM analysis of the data. b SDM analysis of the data
Fig. 4
Fig. 4
Simulation of the effect of the mean transit time parameter upon tumor growth. The effect of the signal transit time (τ) upon tumor volume progression in the presence of a fixed concentration of drug was examined for the two models by simulation. A first-order unperturbed growth model (Eq. 10) was employed for both the CDM and SDM, and the Hill equation in the SDM (Eq. 6) was reduced to a simple linear function (kC p). The values of the model parameters were fixed for both models: k = 0.5, k g = 0.1, w o = 0.05, C p = 1 unit. Importantly, the drug concentration (C p) was 5-fold greater than the effective threshold concentration, i.e., the k g/k ratio in the CDM. Ordinate represents magnitude of effect (arbitrary units). a Behavior of the cell distribution model; b behavior of the signal distribution model

Similar articles

Cited by

References

    1. Sheiner LB, Stanski DR, Vozeh S, Miller RD, Ham J. Simultaneous modeling of pharmacokinetics and pharmacodynamics: application to d-tubocurarine. Clin Pharmacol Ther. 1979;25:358–71. - PubMed
    1. Dayneka NL, Garg V, Jusko WJ. Comparison of four basic models of indirect pharmacodynamic responses. J Pharmacokinet Biopharm. 1993;21:457–78. doi: 10.1007/BF01061691. - DOI - PMC - PubMed
    1. van Steeg TJ, Freijer J, Danhof M, de Lange EC. Pharmacokinetic-pharmacodynamic modelling of S(−)-atenolol in rats: reduction of isoprenaline-induced tachycardia as a continuous pharmacodynamic endpoint. Br J Pharmacol. 2007;151:356–66. doi: 10.1038/sj.bjp.0707234. - DOI - PMC - PubMed
    1. Mager DE, Wyska E, Jusko WJ. Diversity of mechanism-based pharmacodynamic models. Drug Metab Dispos. 2003;31:510–8. doi: 10.1124/dmd.31.5.510. - DOI - PubMed
    1. Gobburu JV, Jusko WJ. Role of dosage regimen in controlling indirect pharmacodynamic responses. Adv Drug Deliv Rev. 1998;33:221–33. doi: 10.1016/S0169-409X(98)00030-1. - DOI - PubMed

Publication types

LinkOut - more resources