. 2010 Mar;78(4):932-49.
doi: 10.1002/prot.22618.

Symmetry-restrained molecular dynamics simulations improve homology models of potassium channels

Affiliations

Symmetry-restrained molecular dynamics simulations improve homology models of potassium channels

Andriy Anishkin et al. Proteins. 2010 Mar.

Abstract

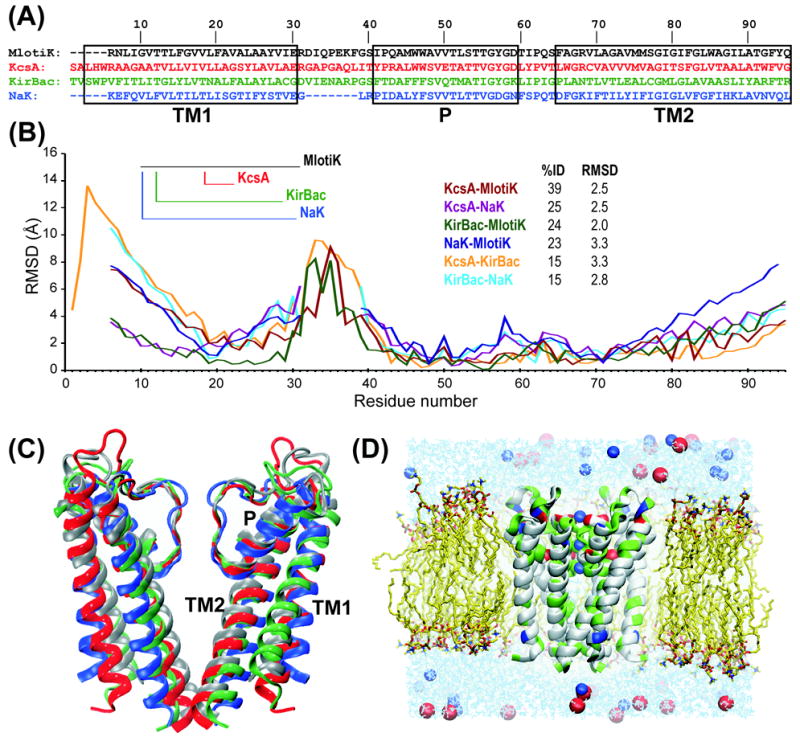
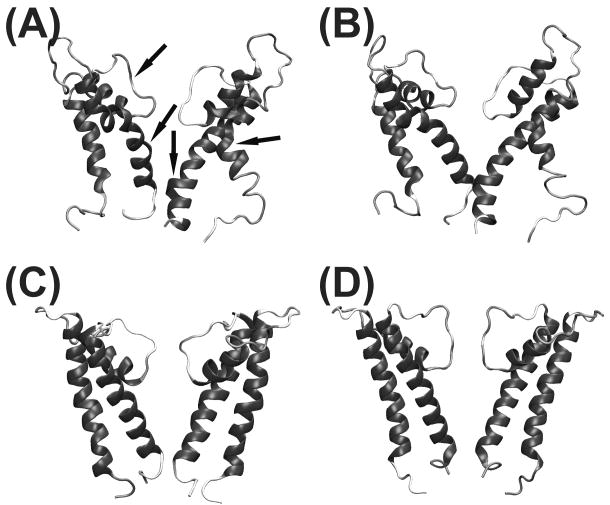
Most crystallized homo-oligomeric ion channels are highly symmetric, which dramatically decreases conformational space and facilitates building homology models (HMs). However, in molecular dynamics (MD) simulations channels deviate from ideal symmetry and accumulate thermal defects, which complicate the refinement of HMs using MD. In this work we evaluate the ability of symmetry constrained MD simulations to improve HMs accuracy, using an approach conceptually similar to Critical Assessment of techniques for protein Structure Prediction (CASP) competition: build HMs of channels with known structure and evaluate the efficiency of proposed methods in improving HMs accuracy (measured as deviation from experimental structure). Results indicate that unrestrained MD does not improve the accuracy of HMs, instantaneous symmetrization improves accuracy but not stability of HMs during subsequent unrestrained MD, while gradually imposing symmetry constraints improves both accuracy (by 5-50%) and stability of HMs. Moreover, accuracy and stability are strongly correlated, making stability a reliable criterion in predicting the accuracy of new HMs. Proteins 2010. (c) 2009 Wiley-Liss, Inc.


Figures

Fig. 1
Fig. 1
Structures used for benchmarking. (A) sequence alignment used for homology modeling, corresponding to the structural alignment. Residue numbering indicates position in the alignment. Rectangles delimit different structural regions: first transmembrane helix (TM1), P segment (P) and second transmembrane helix (TM2); (B) Deviation between the four structures as a function of residue number (the numbering scheme is maintained). The inset table indicates the percentage of sequence identity on the first column and the average RMSD (Å) between structures on the second column; (C) structure superposition of the four channels. Coloring code and structural regions are the same as in panel (A). Only two subunits are displayed for clarity; (D) sample simulation system, including the protein embedded in the lipid bilayer, water and counterions.
Fig. 2
Fig. 2
Symmetry-driven simulated annealing scheme (See Methods for details).
Fig. 3
Fig. 3
Simulation protocol used for all systems.
Fig. 4
Fig. 4
RMSD of all Cα atoms as a function of simulation time (ns), calculated using the crystal structure of the target channel as reference, for crystal structures and HMs of each protein: MlotiK (first row) KcsA (second row), NaK (third row) and KirBac (fourth row). The color scheme is the same as in Fig. 3 but only trajectories corresponding to the central and rightmost branches in Fig. 3 are displayed, for clarity. The dashed, grey lines correspond to the RMSD between the crystal structure and the initial model, before any simulation.
Fig. 5
Fig. 5
RMSD of Cα atoms of the core region (calculated using the crystal structure of the target as reference) as a function of simulation time (ns), where core is defined as: residues 163 to 210 for MlotiK, residues 63 to 110 for KcsA, residues 51 to 98 for NaK and residues 84 to 131 for KirBac. The order of the plots is the same as in Fig. 4. The color scheme is the same as in Fig. 3 but only trajectories corresponding to the rightmost branch in Fig. 3 are displayed, for clarity.
Fig. 6
Fig. 6
Pore shape calculated using the program HOLE, for the crystal structures and HMs (before simulation and after the second symmetry annealing). Pore regions that are inaccessible to water (pore radius < 1.15 Å) are red, water accessible parts (1.15 Å < pore radius < 2.30 Å) are green and wide areas (pore radius > 2.30 Å are blue). Plots represent pore radius as a function of z coordinate, for the crystal structure (gray), symmetricized crystal structure (black), initial homology model (orange) and symmetricized model (red).
Fig. 7
Fig. 7
Deviation from the crystal structure of Cα atoms of each residue, calculated for the initial models, the models at the end of second annealing step and the crystal structure at the end of the second annealing step. Core trace was used for alignment.
Fig. 8
Fig. 8
Structural stability during unrestrained simulation, calculated as RMSD of Cα atoms from the initial structure of each trajectory. Only the first 8ns of unrestrained simulation are shown (black lines). The color scheme is the same as in Fig. 3.
Fig. 9
Fig. 9
Healing of thermal defects by symmetry annealing. (A) most thermally damaged structure after 8 ns simulation at 600K without CMAP correction; (B) the structure after unrestrained simulation at 300K, with CMAP correction; (C) the structure after symmetry annealing at 600K, without CMAP correction; (D) the structure after the symmetry annealing at 300K, with CMAP correction.

References

    1. Yildirim MA, Goh KI, Cusick ME, Barabási AL, Vidal M. Drug-target network. Nat Biotechnol. 2007;25(10):1119–1126. - PubMed
    1. Jayasinghe S, Hristova K, White SH. MPtopo: A database of membrane protein topology. Protein Sci. 2001;10(2):455–458. - PMC - PubMed
    1. Xiang Z. Advances in homology protein structure modeling. Curr Protein Pept Sci. 2006;7(3):217–227. - PMC - PubMed
    1. Ginalski K. Comparative modeling for protein structure prediction. Curr Opin Struct Biol. 2006;16(2):172–177. - PubMed
    1. Kryshtafovych A, Venclovas C, Fidelis K, Moult J. Progress over the first decade of CASP experiments. Proteins. 2005;61 7:225–236. - PubMed

Publication types

MeSH terms

Substances

LinkOut - more resources