. 2009;11(7):912-22.
doi: 10.3109/14653240903136987.

Optimization and validation of a robust human T-cell culture method for monitoring phenotypic and polyfunctional antigen-specific CD4 and CD8 T-cell responses

Affiliations

Optimization and validation of a robust human T-cell culture method for monitoring phenotypic and polyfunctional antigen-specific CD4 and CD8 T-cell responses

Yun Lin et al. Cytotherapy. 2009.

Abstract

Background aims: Monitoring cellular immune responses is one prerequisite for the rational development of cancer vaccines.

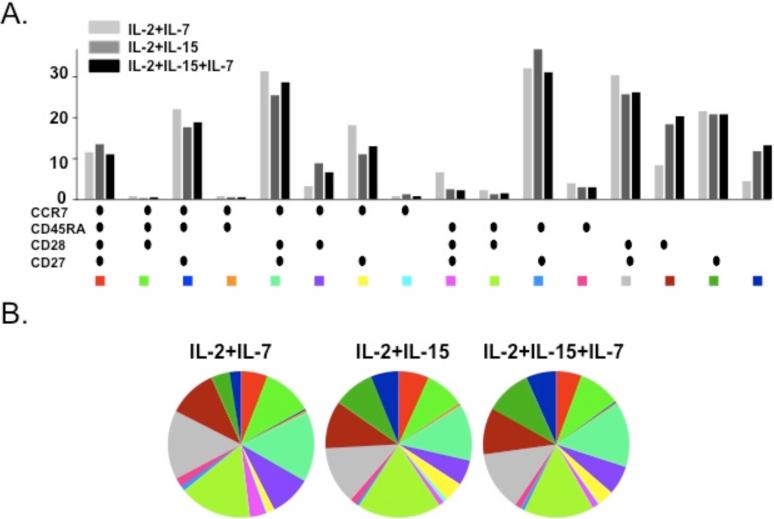
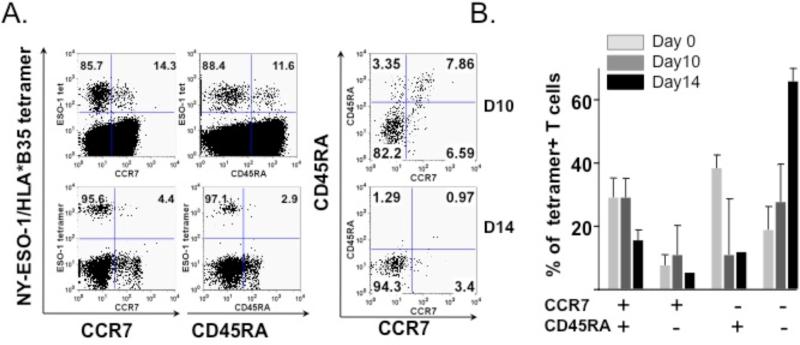
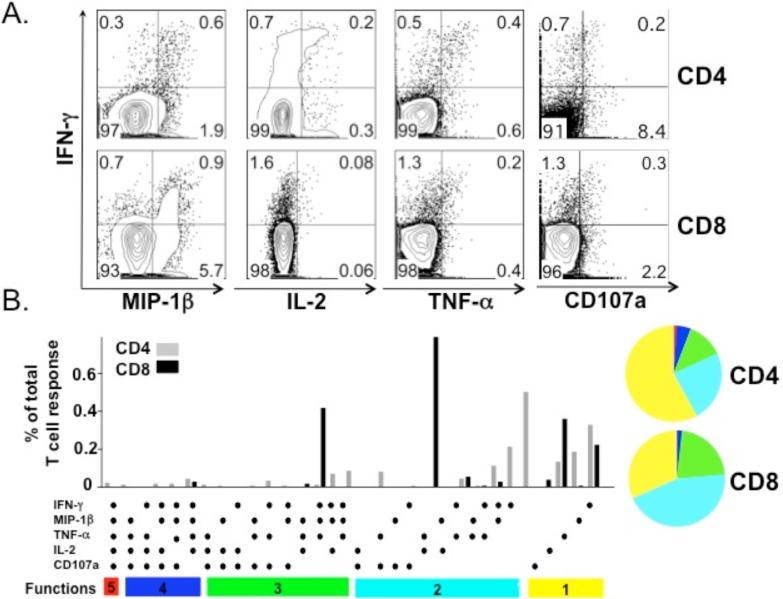
Methods: We describe an extensive effort to optimize and validate quantitatively an in vitro T-cell culture method by determining the phenotype and function of both CD4(+) and CD8(+) T cells, including measurement of the phenotype markers CCR7, CD45RA, CD28 and CD27 and the functional markers interferon (IFN)-gamma, interleukin (IL)-2, macrophage inflammatory protein (MIP)-1beta, tumor necrosis factor (TNF)-alpha and CD107a.

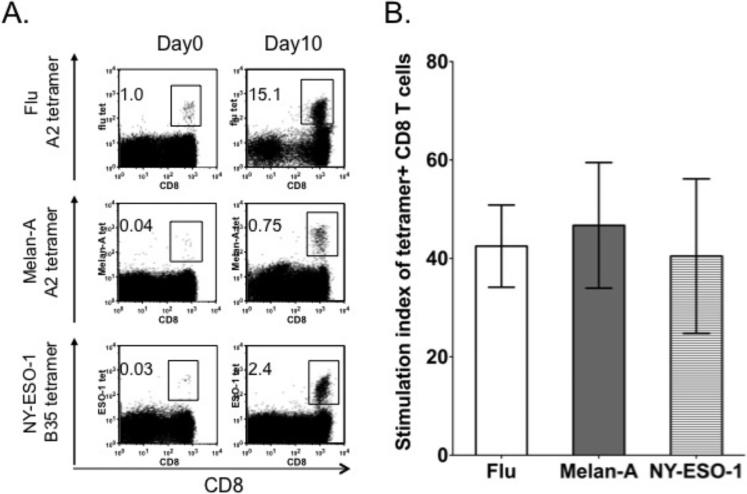
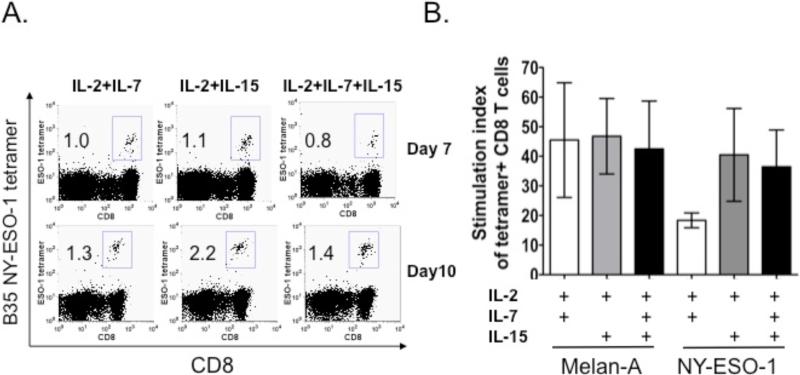
Results: Autologous peripheral blood mononuclear cells (PBMC) were potent stimulators that expanded antigen (Ag)-specific CD8(+) T cells during short-term culture with the addition of IL-2 and IL-15 cytokines. Polyfunctional Ag-specific CD4(+) and CD8(+) T cells were detectable using this method.

Conclusions: Our culture system represents a robust human T-cell culture protocol that permits phenotypic, quantitative and qualitative evaluation of vaccine-induced CD4(+) and CD8(+) T-cell responses.


Figures

Figure 1
Figure 1. Autologous PBMCs function as potent stimulators to expand antigen-specific CD8+ T cells during short term in vitro culture
PBMCs were stimulated with corresponding peptide-pulsed and irradiated autologous PBMCs at an effector:APC ratio of 1:1 with addition of cytokines IL-2 (10 IU/ml) and IL-15 (10 ng/ml). (A) Representative dot plots of flu, Melan-A and NY-ESO-1 antigen specific tetramers are shown at baseline (Day 0) and after in vitro stimulation (Day 10). (B) The stimulation index of tetramer-positive cells, calculated as the absolute number of tetramer-positive cells at the end of each stimulation over the number of tetramer-positive cells in the initial culture. The results represent three independent experiments and the error bars represent the standard error of the mean.
Figure 2
Figure 2. The combination of IL-2 and IL-15 cytokines enhances the expansion of tetramer-reactive CD3+CD8+ T cells
PBMCs were stimulated with the corresponding peptide-pulsed autologous PBMCs with irradiation. Different combinations of cytokines IL-2 (10 IU/ml), IL-7 (10 ng/ml) and IL-15 (10 ng/ml) were added to the cell culture as indicated. (A) Representative dot plots of NY-ESO-1 antigen tetramer-positive CD3+CD8+ T cells are shown at Day 7 and Day 10 after in vitro stimulation. (B) The stimulation index of tetramer-positive cells for Melan-A and NY-ESO-1 peptide stimulation under different cytokine conditions. These results are the summary of three experiments: for the Melan-A peptide condition, PBMCs from several patients were repeated three times while; for the NY-ESO-1 peptide condition, PBMCs from one patient were used for three separate experiments. For NY-ESO-1 peptide stimulation, IL-2 plus IL-15 resulted in greater stimulation than IL-2 plus IL-7. The addition of IL-7 to IL-2 and IL-15 did not result in further stimulation. Melan-A peptide-stimulated expansion appeared to be similar across each of the three cytokine conditions.
Figure 3
Figure 3. Irradiation enhances the expansion of Melan-A tetramer-positive CD3+CD8+ T cells
The difference in the expansion of Melan-A tetramer-positive CD3+CD8+ T cells between irradiated and non-irradiated Melan-A peptide-pulsed APCs was significant (p=0.013).
Figure 4
Figure 4. The phenotypic profiles of fluMP, Melan-A and NY-ESO-1 tetramer-positive CD3+CD8+ cells are not affected by different cytokine conditions in culture medium
Multiparameter flow cytometry was performed to analyze the phenotype of tetramer-positive CD3+CD8+ cells after a 10-day in vitro culture with MelanA peptide stimulation using the markers CCR7, CD45RA, CD27 and CD28 under three different cytokine conditions in the growth medium: IL-2 + IL-7, IL-2 + IL-15 and IL-2 + IL-7 + IL-15. Figure 4A represents a bar chart of the different phenotypic combinations under the three different cytokine conditions. Figure 4B is a pie chart representing the different phenotypic combinations for each cytokine condition.
Figure 5
Figure 5. Longer culture time leads to expansion of the CD8+ CCR7-CD45RA- subset
Multiparameter flow cytometry with the markers CCR7 and CD45RA was performed to analyze the phenotype of tetramer-positive CD3+CD8+ cells after 10 and 14 days of in vitro culture. (A) A representative dot plot indicates an increase in the population of CCR7-CD45RA- NY-ESO-1 tetramer-positive CD3+CD8+ T cells between Days 10 and 14 of in vitro culture. (B) This chart represents an average of CCR7/CD45RA subsets for fluMP, Melan-A and NY-ESO-1 tetramer-positive CD3+CD8+ T cells at Day 0, 10 and 14 of in vitro culture. The proportion of CCR7-CD45RA- cells increases with the length of culture time.
Figure 6
Figure 6. Polyfunctional NY-ESO-1 specific CD4+ and CD8+ T cell responses
Representative ICS and chemokine staining of both CD4+ and CD8+ T cells responding to NY-ESO-1 pooled peptides from a NY-ESO-1 seropositive patient after a 10-day culture with IL-2 and IL-15. (A) Representative dot plots indicate that NY-ESO-1 specific CD4+ and CD8+ T cells secrete IL-2, MIP-1β, IFN-γ and TNF-α. (B) Functional composition of the CD4+ and CD8+ T cell response. All possible combinations of four selected functional responses are shown on the x-axis. Responses are grouped and color-coded. Each slice of the pie charts represents the fraction of the total response that is positive for a given number of functions.

Comment in

Similar articles

Cited by

References

    1. Simpson AJ, Caballero OL, Jungbluth A, Chen YT, Old LJ. Cancer/testis antigens, gametogenesis and cancer. Nat Rev Cancer. 2005;5:615–625. - PubMed
    1. Gnjatic S, Nishikawa H, Jungbluth AA, Gure AO, Ritter G, Jager E, Knuth A, Chen YT, Old LJ. NY-ESO-1: review of an immunogenic tumor antigen. Adv Cancer Res. 2006;95:1–30. - PubMed
    1. Romero P, Valmori D, Pittet MJ, Zippelius A, Rimoldi D, Levy F, Dutoit V, Ayyoub M, Rubio-Godoy V, Michielin O, et al. Antigenicity and immunogenicity of Melan-A/MART-1 derived peptides as targets for tumor reactive CTL in human melanoma. Immunol Rev. 2002;188:81–96. - PubMed
    1. Janetzki S, Panageas KS, Ben-Porat L, Boyer J, Britten CM, Clay TM, Kalos M, Maecker HT, Romero P, Yuan J, et al. Results and harmonization guidelines from two large-scale international Elispot proficiency panels conducted by the Cancer Vaccine Consortium (CVC/SVI). Cancer Immunol Immunother. 2008;57:303–315. - PMC - PubMed
    1. Jager E, Nagata Y, Gnjatic S, Wada H, Stockert E, Karbach J, Dunbar PR, Lee SY, Jungbluth A, Jager D, et al. Monitoring CD8 T cell responses to NY-ESO-1: correlation of humoral and cellular immune responses. Proc Natl Acad Sci U S A. 2000;97:4760–4765. - PMC - PubMed

Publication types

MeSH terms