. 2009 Nov;3(6):297-314.
doi: 10.1111/j.1750-2659.2009.00103.x.

Genomic events underlying the changes in adamantane resistance among influenza A(H3N2) viruses during 2006-2008

Affiliations

Genomic events underlying the changes in adamantane resistance among influenza A(H3N2) viruses during 2006-2008

Varough Deyde et al. Influenza Other Respir Viruses. 2009 Nov.

Abstract

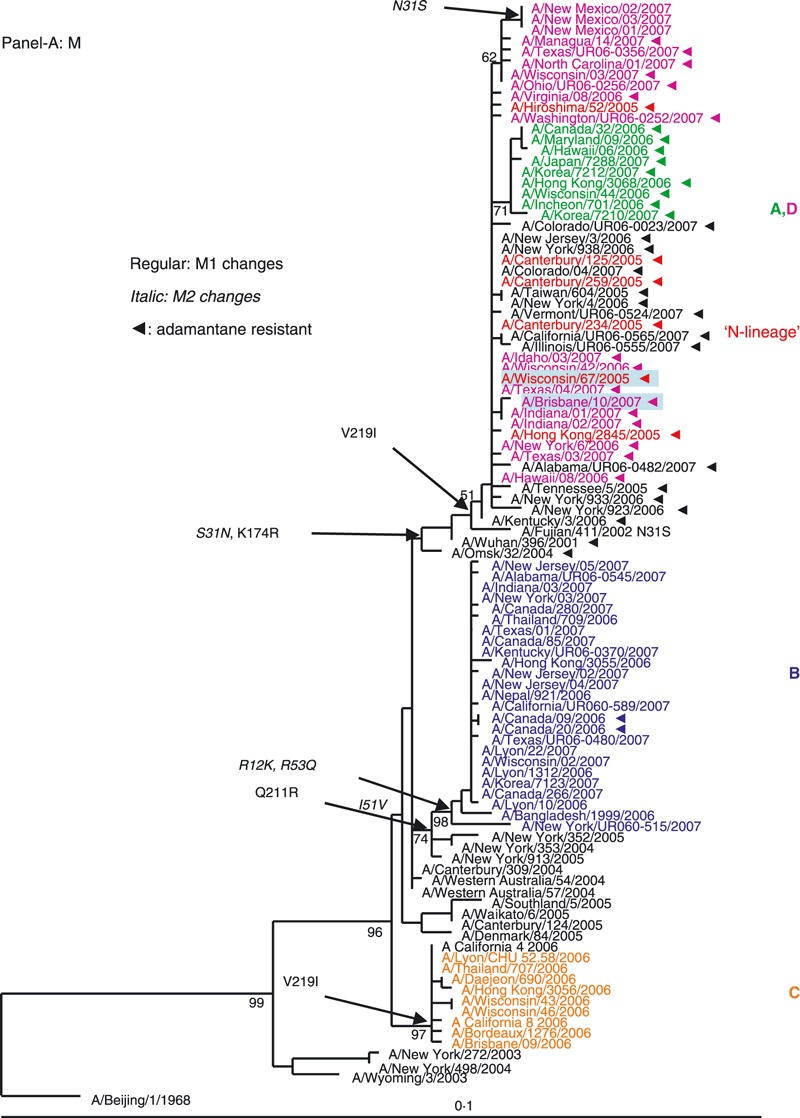
Background: Adamantanes resistance in H3N2 viruses has been increasing since 2000, and in 2005-2006 reached nearly 100% in most countries, with the circulation of the N-lineage. In 2006-2007, however, a significant decrease in resistance was observed in many regions.

Objectives: To explore potential links between adamantane resistance and the A(H3N2) viruses that circulated between 2006 and 2008.

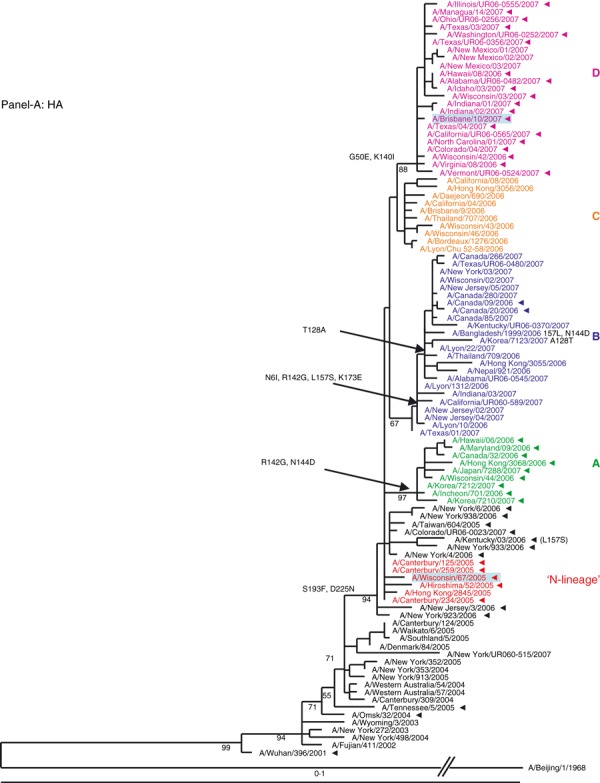
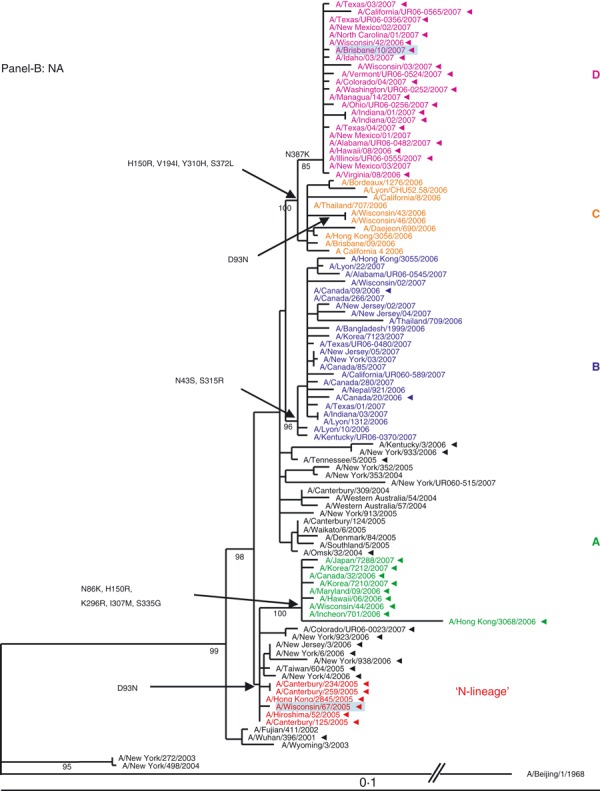
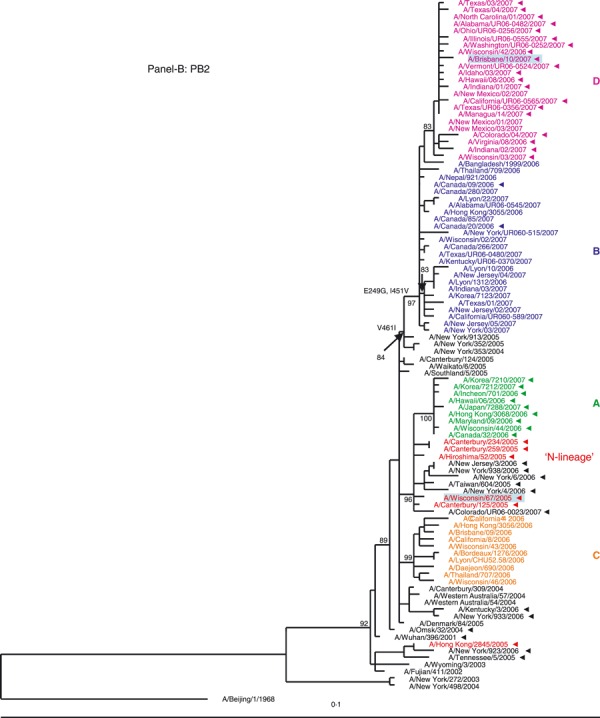
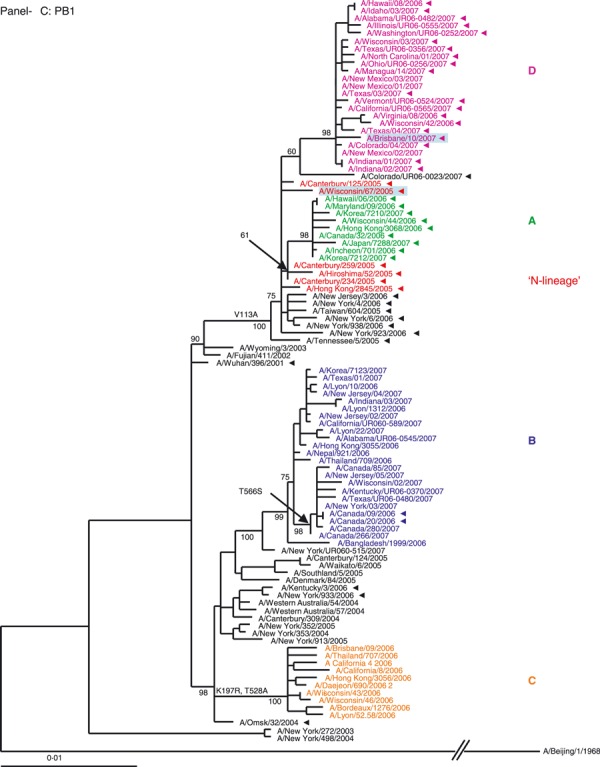
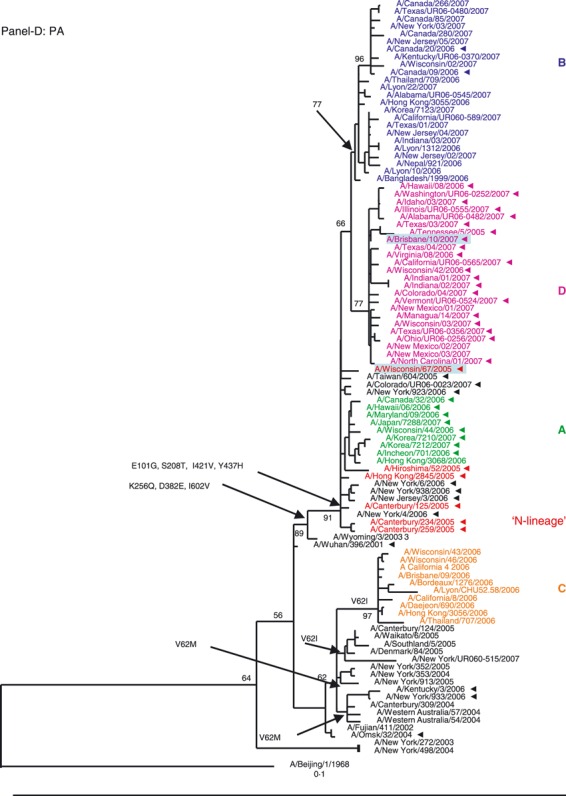
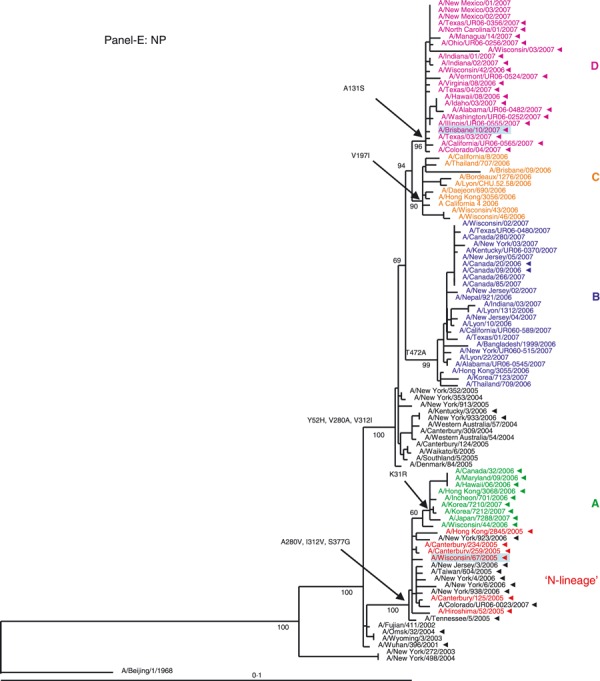
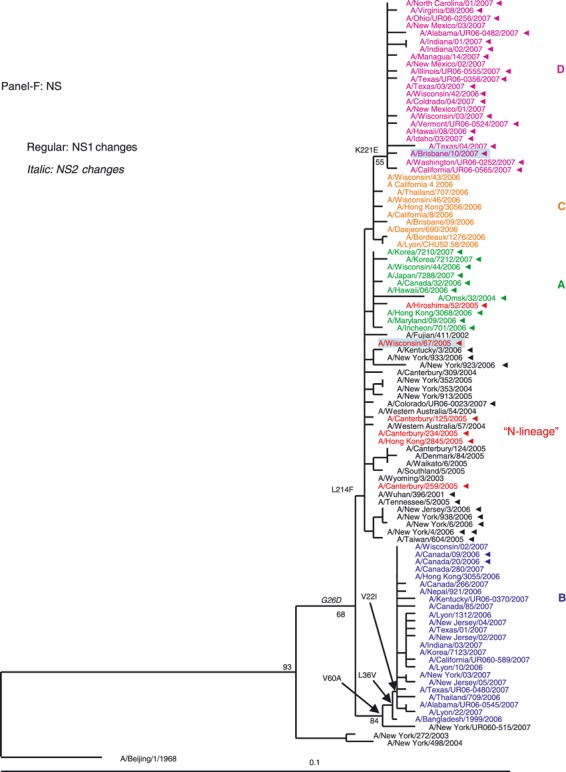
Methods: A total of 1451 Influenza A (H3N2) viruses collected globally in 2001-2008 were screened for the presence of adamantane resistance markers. A subset of 100 viruses representing the broad genetic and geographic spectrum of these viruses was selected for complete genome sequencing and phylogenetic analyses.

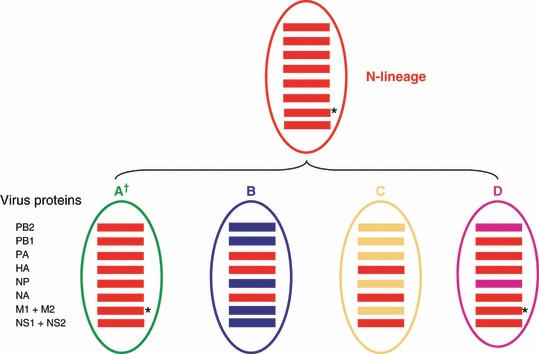
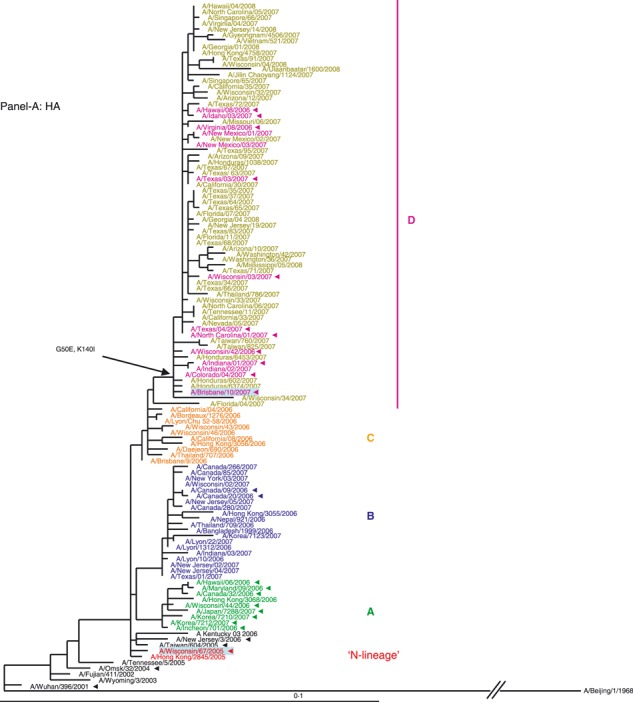
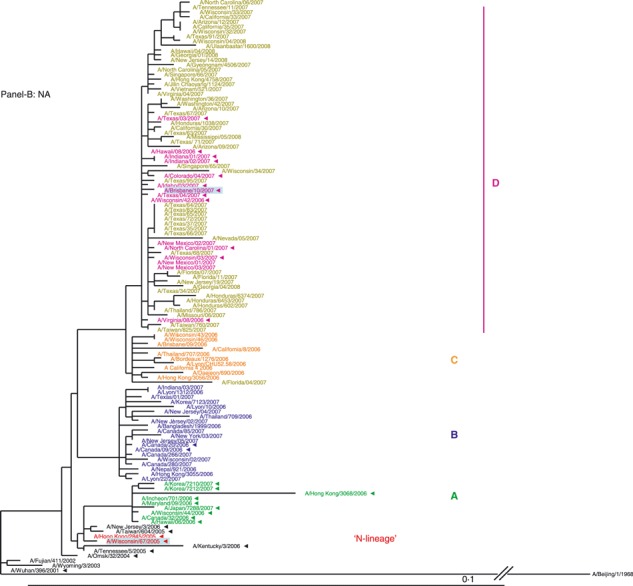
Results: Full genome sequence analysis of 2006-2007 viruses revealed co-circulation of four distinct genotypes, designated A-D. Phylogenetic analyses demonstrated reassortment between viruses from the N-lineage and other viruses that had circulated in prior seasons, including those bearing an adamantane sensitive marker. Genotype D viruses became dominant in late 2006-2007 and continued to be the main H3N2 genotype in 2007-2008. Viruses of this genotype retained all N-lineage genome segments except PB2 and NP, which were acquired through reassortment.

Conclusions: The decrease in adamantane resistance at that time was due to transient co-circulation of genotypes that emerged through reassortment. Our findings emphasize the importance of complete genome sequencing in understanding the complex nature of the relationship between influenza virus evolution and antiviral resistance. The recent emergence of the pandemic multi-reassortant H1N1 virus underscores the importance of whole genome sequence monitoring for rapid detection of such unusual and novel strains.


Figures

Figure 1
Figure 1
(A, B) Evolution of the surface antigens HA1 and NA genes of A(H3N2) viruses sampled during the 2006–2007 season. Phylogenetic tree was constructed from the HA1 genes of viruses sequenced during the study (n = 64) and 36 viruses with full genome sequences available in public domain. Trees were inferred using maximum likelihood available in garli 0·96b7 package. Using paup package bootstrap values, shown on tree branch nodes, were calculated from 100 replicates using of the data set to ensure robustness of the analysis (the results and parameters for each segments data set are available upon request). Phylogenetic trees throughout the manuscript were rooted with A/Beijing/1/1968, which was used as an out‐group. For clarity, the N‐lineage and four major genetic clades A–D are color‐coded in all figures according to their respective HA clade (N‐lineage – red, clade A – green, B – blue, C – orange, and D – purple). Characteristic amino acid changes are shown at the appropriate nodes. Vaccine strains for 2006–2007 and 2007–2008 seasons, A/Wisconsin/67/2005, and A/Brisbane/10/2007, respectively, are highlighted in light blue. Solid arrowheads indicate resistance to adamantanes.
Figure 1
Figure 1
(A, B) Evolution of the surface antigens HA1 and NA genes of A(H3N2) viruses sampled during the 2006–2007 season. Phylogenetic tree was constructed from the HA1 genes of viruses sequenced during the study (n = 64) and 36 viruses with full genome sequences available in public domain. Trees were inferred using maximum likelihood available in garli 0·96b7 package. Using paup package bootstrap values, shown on tree branch nodes, were calculated from 100 replicates using of the data set to ensure robustness of the analysis (the results and parameters for each segments data set are available upon request). Phylogenetic trees throughout the manuscript were rooted with A/Beijing/1/1968, which was used as an out‐group. For clarity, the N‐lineage and four major genetic clades A–D are color‐coded in all figures according to their respective HA clade (N‐lineage – red, clade A – green, B – blue, C – orange, and D – purple). Characteristic amino acid changes are shown at the appropriate nodes. Vaccine strains for 2006–2007 and 2007–2008 seasons, A/Wisconsin/67/2005, and A/Brisbane/10/2007, respectively, are highlighted in light blue. Solid arrowheads indicate resistance to adamantanes.
Figure 2
Figure 2
Phylogenetic analysis of the six internal gene segments of 2006–2007 A(H3N2). Phylogenetic trees were inferred and labeled as in Figure 1. Overall, the trees inferred from the internal gene segment revealed presence of the four major genetic clades, as obtained with the HA and NA segments (A–F). Noteworthy, M and PB1 phylogenies showed that clades B and D (A/Japan/7288/2007‐like and A/Brisbane/10/2006‐like), representing adamantane‐resistant viruses formed a single group; while viruses in groups B and C formed two distinct clades of adamantane‐sensitive viruses (A and C). See legend to Figure 1 for color codes.
Figure 2
Figure 2
Phylogenetic analysis of the six internal gene segments of 2006–2007 A(H3N2). Phylogenetic trees were inferred and labeled as in Figure 1. Overall, the trees inferred from the internal gene segment revealed presence of the four major genetic clades, as obtained with the HA and NA segments (A–F). Noteworthy, M and PB1 phylogenies showed that clades B and D (A/Japan/7288/2007‐like and A/Brisbane/10/2006‐like), representing adamantane‐resistant viruses formed a single group; while viruses in groups B and C formed two distinct clades of adamantane‐sensitive viruses (A and C). See legend to Figure 1 for color codes.
Figure 3
Figure 3
Schematic representation of four genotypes in A(H3N2) viruses co‐circulating in 2006–2007 season. Genetic analysis of individual segments revealed that the 2006–2007 belonged to one of four gene constellations. Viruses of genotypes B (blue) and C (orange) are sensitive to adamantanes, whereas viruses in genotypes A (green) and D (purple) are adamantane‐resistant. The N‐lineage viruses are colored in red. Genetic groups are defined based on the HA and NA gene segment phylogenies.
Figure 4
Figure 4
Phylogenetic trees were constructed from 119 viruses, including 55 HA1 (A) and NA (B) gene sequences of viruses sampled globally from October 2007 through April 2008 and showed that the genotype D remained dominant in circulation in the 2007–2008 influenza season. Trees were generated and labeled as in Figure 1, and strain designations of the 2007–2008 viruses were colored in olive for distinction.
Figure 4
Figure 4
Phylogenetic trees were constructed from 119 viruses, including 55 HA1 (A) and NA (B) gene sequences of viruses sampled globally from October 2007 through April 2008 and showed that the genotype D remained dominant in circulation in the 2007–2008 influenza season. Trees were generated and labeled as in Figure 1, and strain designations of the 2007–2008 viruses were colored in olive for distinction.

References

    1. Fitch WM, Leiter JM, Li XQ, Palese P. Positive Darwinian evolution in human influenza A viruses. Proc Natl Acad Sci USA 1991; 88:4270–4274. - PMC - PubMed
    1. Fitch WM, Bush RM, Bender CA, Cox NJ. Long term trends in the evolution of H(3) HA1 human influenza type A. Proc Natl Acad Sci USA 1997; 94:7712–7718. - PMC - PubMed
    1. Holmes EC, Ghedin E, Miller N et al. Whole‐genome analysis of human influenza A virus reveals multiple persistent lineages and reassortment among recent H3N2 viruses. PLoS Biol 2005; 3:e300. - PMC - PubMed
    1. Nelson MI, Viboud C, Simonsen L et al. Multiple reassortment events in the evolutionary history of H1N1 influenza A virus since 1918. PLoS Pathog 2008; 4:e10000126. - PMC - PubMed
    1. Hay AJ, Zambon MC, Wolstenholme AJ, Skehel JJ, Smith MH. Molecular basis of resistance of influenza A viruses to amantadine. J Antimicrob Chemother 1986; 18(Suppl B):19–29. - PubMed

Publication types