Comparative Study
. 2009 Nov 10:9:234.
doi: 10.1186/1471-2180-9-234.

Performance of optimized McRAPD in identification of 9 yeast species frequently isolated from patient samples: potential for automation

Affiliations
Comparative Study

Performance of optimized McRAPD in identification of 9 yeast species frequently isolated from patient samples: potential for automation

Jitka Trtkova et al. BMC Microbiol. .

Abstract

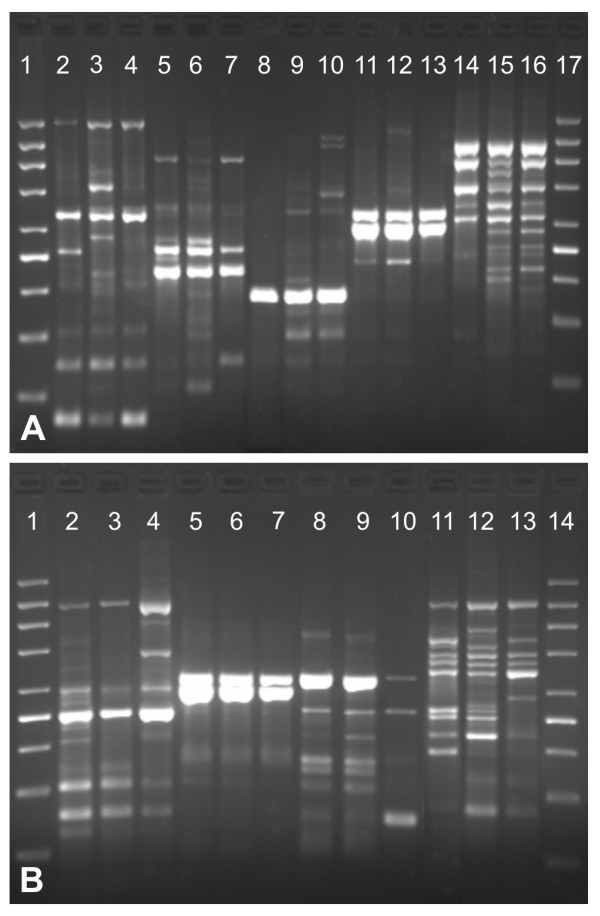
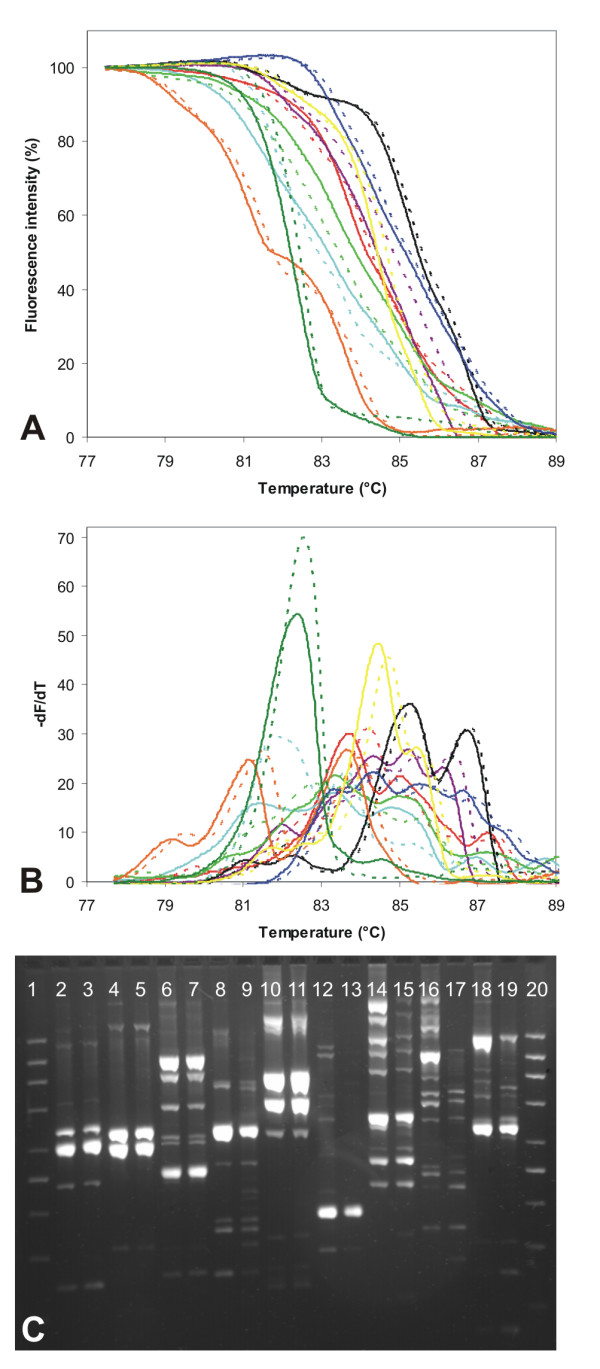
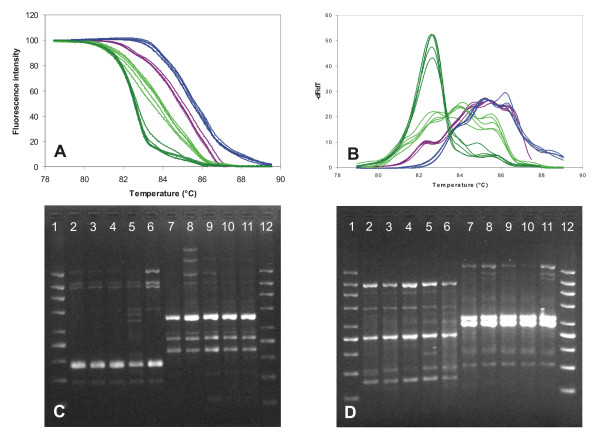
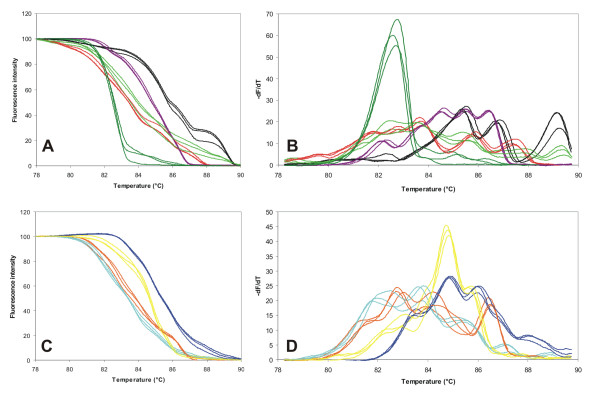
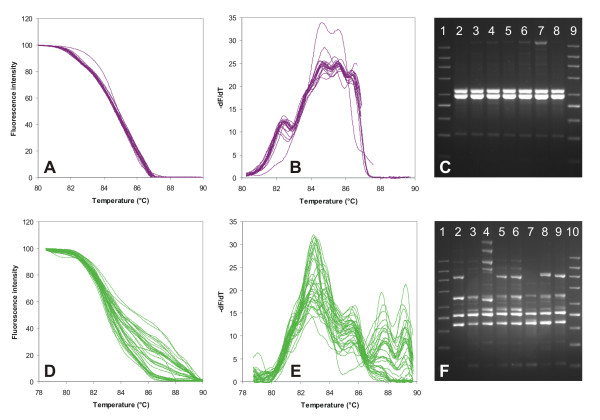
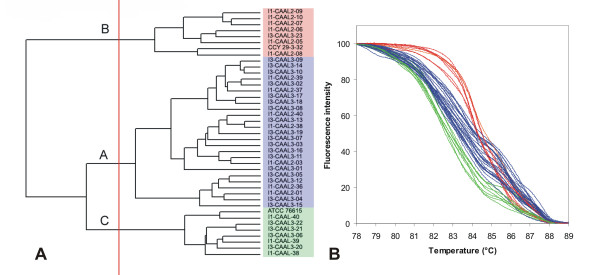
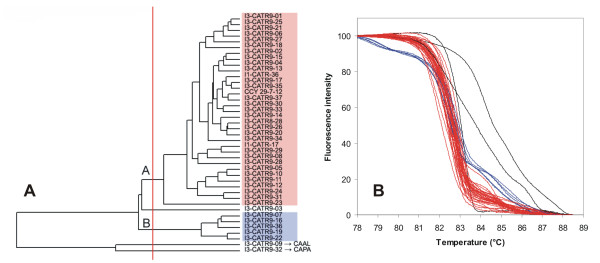
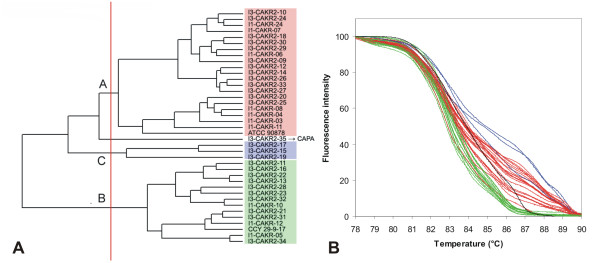
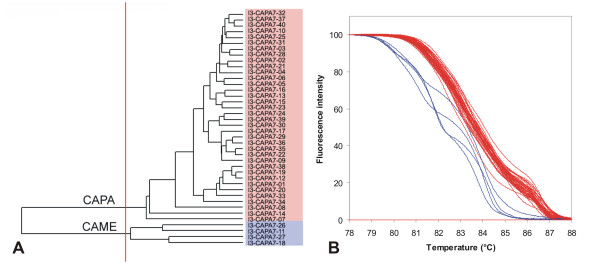
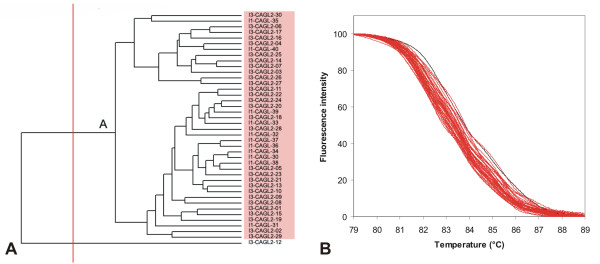
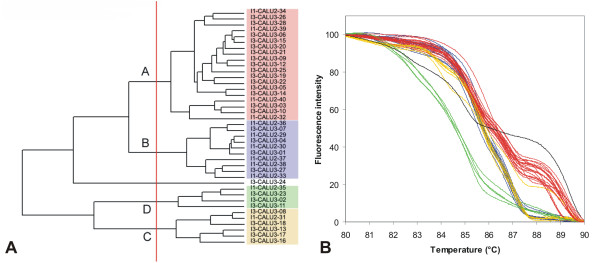
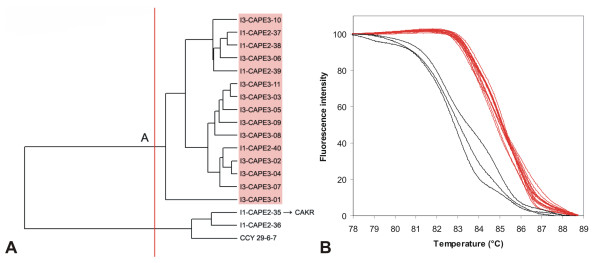
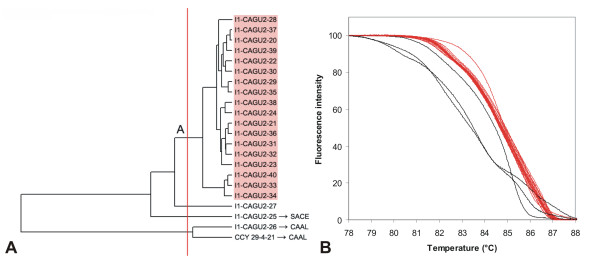
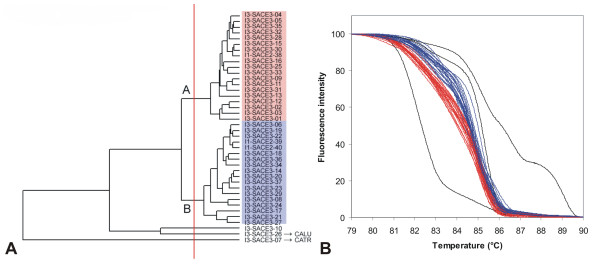
Background: Rapid, easy, economical and accurate species identification of yeasts isolated from clinical samples remains an important challenge for routine microbiological laboratories, because susceptibility to antifungal agents, probability to develop resistance and ability to cause disease vary in different species. To overcome the drawbacks of the currently available techniques we have recently proposed an innovative approach to yeast species identification based on RAPD genotyping and termed McRAPD (Melting curve of RAPD). Here we have evaluated its performance on a broader spectrum of clinically relevant yeast species and also examined the potential of automated and semi-automated interpretation of McRAPD data for yeast species identification.

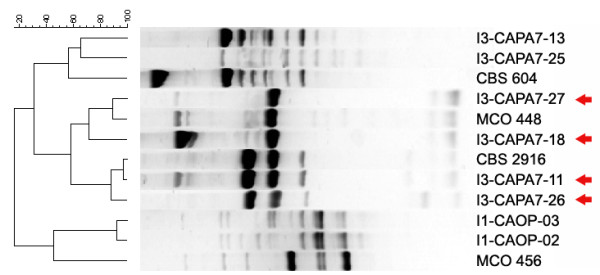
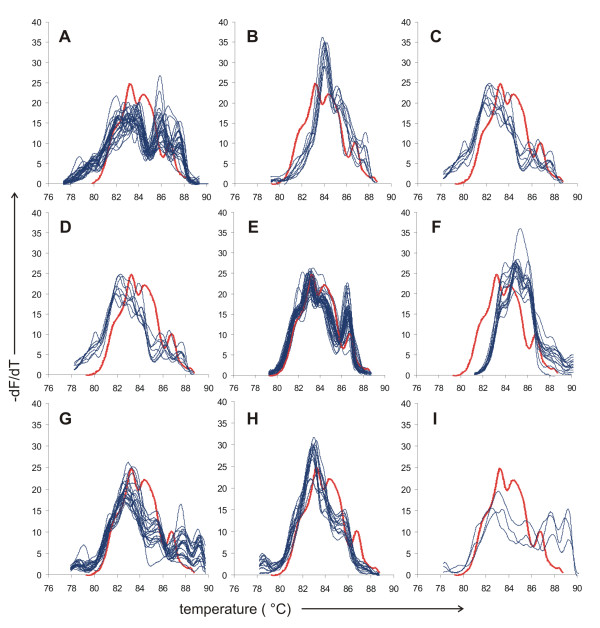
Results: A simple fully automated algorithm based on normalized melting data identified 80% of the isolates correctly. When this algorithm was supplemented by semi-automated matching of decisive peaks in first derivative plots, 87% of the isolates were identified correctly. However, a computer-aided visual matching of derivative plots showed the best performance with average 98.3% of the accurately identified isolates, almost matching the 99.4% performance of traditional RAPD fingerprinting.

Conclusion: Since McRAPD technique omits gel electrophoresis and can be performed in a rapid, economical and convenient way, we believe that it can find its place in routine identification of medically important yeasts in advanced diagnostic laboratories that are able to adopt this technique. It can also serve as a broad-range high-throughput technique for epidemiological surveillance.


Figures

Figure 1
Figure 1
Results of optimization of the amount of crude colony lysates added into reaction mixture. Lanes are arranged in triplicates where each triplicate of lanes represents results obtained with the same strain. Individual lanes within each triplicate represent variable amount of crude colony lysate added into the reaction mixture, namely 0.5, 1, and 2 μl in the order from left to right. Part (A), lane 1 and 17: molecular weight marker 200-1500 (Top-Bio, Prague, Czech Republic), lanes 2-4: C. albicans ATCC 76615; lanes 5-7: C. krusei I1-CAKR-24; lanes 8-10: C. tropicalis I3-CATR9-37; lanes 11-13: C. lusitaniae I1-CALU-33; lanes 14-16: C. parapsilosis CBS 604; part (B), lane 1 and 14: molecular weight marker 200-1500 (Top-Bio, Prague, Czech Republic), lanes 2-4: C. pelliculosa I3-CAPE3-10; lanes 5-7: C. guilliermondii I1-CAGU2-20; lanes 8-10: S. cerevisiae I3-SACE3-37; lanes 11-13: C. glabrata I1-CAGL-32.
Figure 2
Figure 2
Comparison of McRAPD results obtained with DNA extracted using the commercial kit YeaStar Genomic DNA Kit (Zymo Research, Orange, CA, USA) and using the technique of crude colony lysates. Selected strains were subjected to DNA extraction in parallel and the DNA was used for McRAPD resulting in duplicates of melting curves and duplicates of agarose gel fingerprints. In each duplicate solid lines in plots and left lanes in gel represent results obtained with the DNA extracted using the commercial kit, whereas dotted lines and right lanes represent results obtained with 1 μl of crude colony lysate. Part (A): normalized melting curves, part (B) derivative curves, part (C) fingerprints obtained with agarose gel electrophoresis, lane 1 and 20 molecular weight marker 200-1500 (Top-Bio, Prague, Czech Republic). Lane 2, 3 and black line C. lusitaniae I1-CALU-33, lane 4, 5 and violet line C. guilliermondii I1-CAGU2-20, lane 6, 7 and blue line C. pelliculosa I3-CAPE3-10, lane 8, 9 and yellow line S. cerevisiae I3-SACE3-37, lane 10, 11 and orange line C. metapsilosis I1-CAME7-11, lane 12,13 and dark green line C. tropicalis I3-CATR9-22, lane 14, 15 and light green line C. krusei I1-CAKR-24, lane 16, 17 and turquoise line C. glabrata I1-CAGL-39, lane 18, 19 and red line C. albicans ATCC 76615.
Figure 3
Figure 3
Reproducibility of McRAPD with crude colony lysates sampled from different colonies at different timepoints. DNA extraction was performed in 4 different yeast species, each represented by one strain, where 5 colonies were subcultured for different time periods in each strain. Part (A) normalized melting curves, part (B) derivative curves, part (C) and (D) fingerprints after agarose gel electrophoresis with the 200-1500 molecular weight marker (Top-Bio, Prague, Czech Republic) in lanes 1 and 12. Dark green lines and lanes 2-6 in part (C) C. tropicalis I3-CATR9-17; light green lines and lanes 7-11 in part (C) C. krusei I1-CAKR-06; violet lines and lanes 2-6 in part (D) C. pelliculosa I3-CAPE3-04; and blue lines and lanes 7-11 in part (D) C. guilliermondii I1-CAGU-22.
Figure 4
Figure 4
Short-term stability of crude colony lysates versus reproducibility of McRAPD data as well as evaluation of inter-run variability of McRAPD data. McRAPD was performed with the same crude colony lysates obtained from 9 strains repeatedly during 3 consecutive days. Parts (A, C) show normalized melting curves, parts (B, D) show derivative curves. Red lines represent C. albicans strain I1-CAAL2-38; dark green lines C. tropicalis I3-CATR9-13; light green lines C. krusei I3-CAKR2-18; violet lines C. guilliermondii I1-CAGU2-21; black lines C. lusitaniae I1-CALU2-32 (all in parts A and B); turquoise C. glabrata I3-CAGL2-15; orange C. parapsilosis I1-CAPA7-28; blue C. pelliculosa I3-CAPE3-04; and yellow S. cerevisiae I1-SACE2-40 (all in parts C and D).
Figure 5
Figure 5
Interstrain variability of McRAPD data in C. guilliermondii (parts A-C; lowest variability in this study) and C. krusei (parts D-F; highest in this study). Parts (A, D) show normalized melting curves, parts (B, E) show derivative curves, parts (C, F) show fingerprints after agarose gel electrophoresis with the 200-1500 molecular weight marker (Top-Bio, Prague, Czech Republic) in lanes 1 and 9 and 10, respectively. All strains of the respective species included in the study are plotted, whereas only fingerprints of selected strains are demonstrated, namely lane 2: I1-CAGU2-35, lane 3: I1-CAGU2-34, lane 4: I1-CAGU2-33, lane 5: I1-CAGU2-32, lane 6: I1-CAGU2-31, lane 7: I1-CAGU2-30, lane 8: I1-CAGU2-29 (all C. guilliermondii)in part (C); lane 2: I3-CAKR2-33, lane 3: I3-CAKR2-32, lane 4: I3-CAKR2-31, lane 5: I3-CAKR2-30, lane 6: I3-CAKR2-29, lane 7: I3-CAKR2-28, lane 8: I3-CAKR2-27, lane 9: I3-CAKR2-26 (all C. krusei) in part (F).
Figure 6
Figure 6
UPGMA clustering of C. albicans strains based on normalized McRAPD data. Clustering with empirically defined genotypes is demonstrated in part (A) and corresponding normalized melting curves are shown in part (B). All strains of the respective species included in the study are clustered and plotted; strains belonging to a specific genotype are highlighted by specific ground tint color in the dendrogram corresponding with the same color of curves in accompanying normalized melting curve plot and derivative plots.
Figure 7
Figure 7
UPGMA clustering of C. tropicalis strains based on normalized McRAPD data. Clustering with empirically defined genotypes is demonstrated in part (A) and corresponding normalized melting curves are shown in part (B). All strains of the respective species included in the study are clustered and plotted; strains belonging to a specific genotype are highlighted by specific ground tint color in the dendrogram corresponding with the same color of curves in accompanying normalized melting curve plot and derivative plots. Three strains not assigned to a specific genotype are not color-coded in dendrogram and their melting curves are plotted in black. Two of these strains were later re-identified as C. albicans and C. parapsilosis.
Figure 8
Figure 8
UPGMA clustering of C. krusei strains based on normalized McRAPD data. Clustering with empirically defined genotypes is demonstrated in part (A) and corresponding normalized melting curves are shown in part (B). All strains of the respective species included in the study are clustered and plotted; strains belonging to a specific genotype are highlighted by specific ground tint color in the dendrogram corresponding with the same color of curves in accompanying normalized melting curve plot and derivative plots. One strain not assigned to a specific genotype is not color-coded in dendrogram and its melting curve is plotted in black. This strain was later re-identified as C. parapsilosis.
Figure 9
Figure 9
UPGMA clustering of C. parapsilosis strains based on normalized McRAPD data. Clustering with empirically defined genotypes is demonstrated in part (A) and corresponding normalized melting curves are shown in part (B). All strains of the respective species included in the study are clustered and plotted; strains belonging to a specific genotype are highlighted by specific ground tint color in the dendrogram corresponding with the same color of curves in accompanying normalized melting curve plot and derivative plots.
Figure 10
Figure 10
UPGMA clustering of C. glabrata strains based on normalized McRAPD data. Clustering with empirically defined genotypes is demonstrated in part (A) and corresponding normalized melting curves are shown in part (B). All strains of the respective species included in the study are clustered and plotted; strains belonging to a specific genotype are highlighted by specific ground tint color in the dendrogram corresponding with the same color of curves in accompanying normalized melting curve plot and derivative plots. One strain not assigned to a specific genotype is not color-coded in dendrogram and its melting curve is plotted in black.
Figure 11
Figure 11
UPGMA clustering of C. lusitaniae strains based on normalized McRAPD data. Clustering with empirically defined genotypes is demonstrated in part (A) and corresponding normalized melting curves are shown in part (B). All strains of the respective species included in the study are clustered and plotted; strains belonging to a specific genotype are highlighted by specific ground tint color in the dendrogram corresponding with the same color of curves in accompanying normalized melting curve plot and derivative plots. One strain not assigned to a specific genotype is not color-coded in dendrogram and its melting curve is plotted in black.
Figure 12
Figure 12
UPGMA clustering of C. pelliculosa strains based on normalized McRAPD data. Clustering with empirically defined genotypes is demonstrated in part (A) and corresponding normalized melting curves are shown in part (B). All strains of the respective species included in the study are clustered and plotted; strains belonging to a specific genotype are highlighted by specific ground tint color in the dendrogram corresponding with the same color of curves in accompanying normalized melting curve plot and derivative plots. Three strains not assigned to a specific genotype are not color-coded in dendrogram and their melting curves are plotted in black. One of these strains was later re-identified as C. krusei.
Figure 13
Figure 13
UPGMA clustering of C. guilliermondii strains based on normalized McRAPD data. Clustering with empirically defined genotypes is demonstrated in part (A) and corresponding normalized melting curves are shown in part (B). All strains of the respective species included in the study are clustered and plotted; strains belonging to a specific genotype are highlighted by specific ground tint color in the dendrogram corresponding with the same color of curves in accompanying normalized melting curve plot and derivative plots. Four strains not assigned to a specific genotype are not color-coded in dendrogram and their melting curves are plotted in black. Two of these strains were later re-identified as C. albicans and another one as S. cerevisiae.
Figure 14
Figure 14
UPGMA clustering of Saccharomyces cerevisiae strains based on normalized McRAPD data. Clustering with empirically defined genotypes is demonstrated in part (A) and corresponding normalized melting curves are shown in part (B). All strains of the respective species included in the study are clustered and plotted; strains belonging to a specific genotype are highlighted by specific ground tint color in the dendrogram corresponding with the same color of curves in accompanying normalized melting curve plot and derivative plots. Three strains not assigned to a specific genotype are not color-coded in dendrogram and their melting curves are plotted in black. Two of these strains were later re-identified as C. lusitaniae and C. tropicalis.
Figure 15
Figure 15
UPGMA clustering of selected C. parapsilosis, orthopsilosis and metapsilosis strains. Altogether 4 strains originally identified as C. parapsilosis (marked by arrows) showed doubtful profiles in McRAPD. When their fingerprints were compared to fingerprints of selected C. parapsilosis (CBS 604), orthopsilosis (MCO 456) and metapsilosis (CBS 2916 and MCO 448) strains identified and verified earlier, they clustered unquestionably with C. metapsilosis.
Figure 16
Figure 16
Visual matching of derivative curves as used for species identification. Plots of derivative curves obtained with all strains assigned to 9 selected species/genotypes versus the derivative curve obtained with a tested isolate are shown as an example to illustrate the visual matching approach. Curve obtained with the tested isolate is always plotted as a bold red line, whereas curves obtained with strains assigned to a known genotype/species are plotted as thin dark blue lines in separate plots as follows: (A) C. albicans genotype A, (B) C. albicans genotype B, (C) C. albicans genotype C, (D) C. glabrata, (E) C. parapsilosis, (F) C. pelliculosa, (G) C. krusei genotype A, (H) C. krusei genotype B, (I) C. krusei genotype C.

Similar articles

Cited by

References

    1. Hobson RP. The global epidemiology of invasive Candida infections - is the tide turning? J Hosp Infect. 2003;55:159–168. doi: 10.1016/j.jhin.2003.08.012. quiz 233. - DOI - PubMed
    1. Warnock DW. Trends in the epidemiology of invasive fungal infections. Nippon Ishinkin Gakkai Zasshi. 2007;48:1–12. doi: 10.3314/jjmm.48.1. - DOI - PubMed
    1. Krcmery V, Barnes AJ. Non-albicans Candida spp. causing fungaemia: pathogenicity and antifungal resistance. J Hosp Infect. 2002;50:243–260. doi: 10.1053/jhin.2001.1151. - DOI - PubMed
    1. Freydiere AM, Guinet R, Boiron P. Yeast identification in the clinical microbiology laboratory: phenotypical methods. Med Mycol. 2001;39:9–33. doi: 10.1080/714030980. - DOI - PubMed
    1. Trtkova J, Raclavsky V. Molecular-genetic approaches to identification and typing of pathogenic Candida yeasts. Biomed Pap Med Fac Univ Palacky Olomouc Czech Repub. 2006;150:51–61. - PubMed

Publication types

MeSH terms

LinkOut - more resources