

Reduced levels of reactive oxygen species correlate with inhibition of apoptosis, rise in thioredoxin expression and increased bovine leukemia virus proviral loads
- PMID: 19903329
- PMCID: PMC2779800
- DOI: 10.1186/1742-4690-6-102
Reduced levels of reactive oxygen species correlate with inhibition of apoptosis, rise in thioredoxin expression and increased bovine leukemia virus proviral loads
Abstract
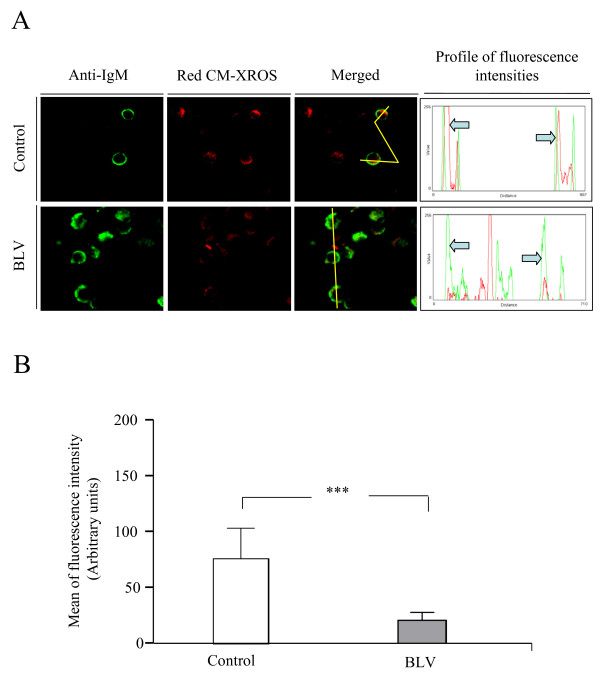
Background: Bovine Leukemia virus (BLV) is a deltaretrovirus that induces lymphoproliferation and leukemia in ruminants. In ex vivo cultures of B lymphocytes isolated from BLV-infected sheep show that spontaneous apoptosis is reduced. Here, we investigated the involvement of reactive oxygen species (ROS) in this process.
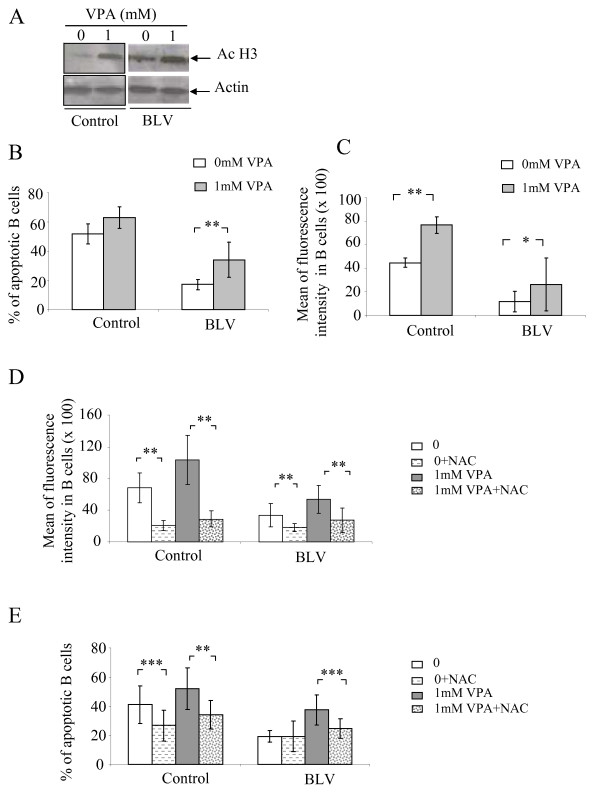
Results: We demonstrate that (i) the levels of ROS and a major product of oxidative stress (8-OHdG) are reduced, while the thioredoxin antioxidant protein is highly expressed in BLV-infected B lymphocytes, (ii) induction of ROS by valproate (VPA) is pro-apoptotic, (iii) inversely, the scavenging of ROS with N-acetylcysteine inhibits apoptosis, and finally (iv) the levels of ROS inversely correlate with the proviral loads.
Conclusion: Together, these observations underline the importance of ROS in the mechanisms of inhibition of apoptosis linked to BLV infection.
Figures


Similar articles
-
Bovine leukemia virus-induced persistent lymphocytosis in cattle does not correlate with increased ex vivo survival of B lymphocytes.J Virol. 1999 Feb;73(2):1127-37. doi: 10.1128/JVI.73.2.1127-1137.1999. J Virol. 1999. PMID: 9882314 Free PMC article.
-
Identification of bovine leukocyte antigen class II haplotypes associated with variations in bovine leukemia virus proviral load in Japanese Black cattle.Tissue Antigens. 2013 Feb;81(2):72-82. doi: 10.1111/tan.12041. Epub 2012 Dec 6. Tissue Antigens. 2013. PMID: 23216331
-
Ex vivo survival of peripheral blood mononuclear cells in sheep induced by bovine leukemia virus (BLV) mainly occurs in CD5- B cells that express BLV.Microbes Infect. 2004 May;6(6):584-95. doi: 10.1016/j.micinf.2004.02.014. Microbes Infect. 2004. PMID: 15158193
-
Emphasis on cell turnover in two hosts infected by bovine leukemia virus: a rationale for host susceptibility to disease.Vet Immunol Immunopathol. 2008 Sep 15;125(1-2):1-7. doi: 10.1016/j.vetimm.2008.04.007. Epub 2008 Apr 16. Vet Immunol Immunopathol. 2008. PMID: 18513803 Review.
-
Cell dynamics and immune response to BLV infection: a unifying model.Front Biosci. 2007 Jan 1;12:1520-31. doi: 10.2741/2165. Front Biosci. 2007. PMID: 17127399 Review.
Cited by
-
Proteome analysis of sheep B lymphocytes in the course of bovine leukemia virus-induced leukemia.Exp Biol Med (Maywood). 2017 Jul;242(13):1363-1375. doi: 10.1177/1535370217705864. Epub 2017 Apr 24. Exp Biol Med (Maywood). 2017. PMID: 28436273 Free PMC article.
-
Programmed cell death in aortic aneurysm and dissection: A potential therapeutic target.J Mol Cell Cardiol. 2022 Feb;163:67-80. doi: 10.1016/j.yjmcc.2021.09.010. Epub 2021 Sep 28. J Mol Cell Cardiol. 2022. PMID: 34597613 Free PMC article. Review.
-
HTLV-1 p13, a small protein with a busy agenda.Mol Aspects Med. 2010 Oct;31(5):350-8. doi: 10.1016/j.mam.2010.03.001. Epub 2010 Mar 21. Mol Aspects Med. 2010. PMID: 20332002 Free PMC article. Review.
-
T cells expanded in presence of IL-15 exhibit increased antioxidant capacity and innate effector molecules.Cytokine. 2011 Aug;55(2):307-17. doi: 10.1016/j.cyto.2011.04.014. Epub 2011 May 23. Cytokine. 2011. PMID: 21602054 Free PMC article.
-
Interaction of porcine circovirus type 2 replication with intracellular redox status in vitro.Redox Rep. 2013;18(5):186-92. doi: 10.1179/1351000213Y.0000000058. Epub 2013 Jul 23. Redox Rep. 2013. PMID: 23902724 Free PMC article.
References
-
- Gillet N, Florins A, Boxus M, Burteau C, Nigro A, Vandermeers F, Balon H, Bouzar AB, Defoiche J, Burny A, Reichert M, Kettmann R, Willems L. Mechanisms of leukemogenesis induced by bovine leukemia virus: prospects for novel anti-retroviral therapies in human. Retrovirology. 2007;4:18. - PMC - PubMed
-
- Matsuoka M, Jeang KT. Human T-cell leukaemia virus type 1 (HTLV-1) infectivity and cellular transformation. Nat Rev Cancer. 2007;7:270–280. - PubMed
-
- Burny A, Cleuter Y, Kettmann R, Mammerickx M, Marbaix G, Portetelle D, Van den BA, Willems L, Thomas R. Bovine leukaemia: facts and hypotheses derived from the study of an infectious cancer. Vet Microbiol. 1988;17:197–218. - PubMed
-
- Depelchin A, Letesson JJ, Lostrie-Trussart N, Mammerickx M, Portetelle D, Burny A. Bovine leukemia virus (BLV)-infected B-cells express a marker similar to the CD5 T cell marker. Immunol Lett. 1989;20:69–76. - PubMed
Publication types
MeSH terms
Substances
LinkOut - more resources
Full Text Sources
